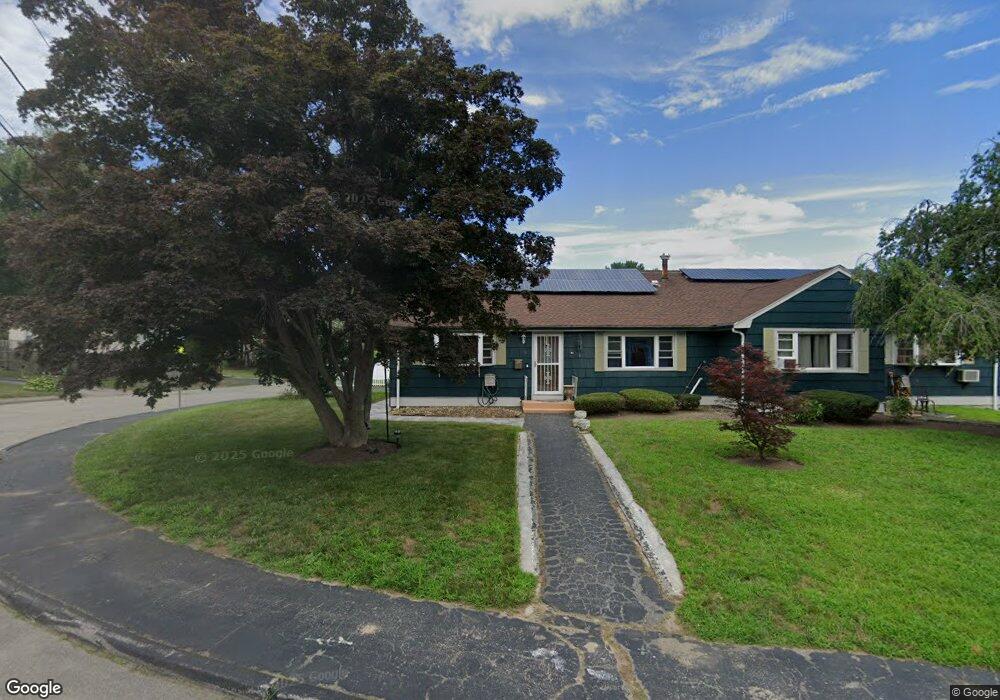
30 Petipas Ln Unit 32 Randolph, MA 02368
Downtown Randolph NeighborhoodEstimated Value: $804,901 - $919,000
4
Beds
2
Baths
2,101
Sq Ft
$402/Sq Ft
Est. Value
About This Home
This home is located at 30 Petipas Ln Unit 32, Randolph, MA 02368 and is currently estimated at $844,475, approximately $401 per square foot. 30 Petipas Ln Unit 32 is a home located in Norfolk County with nearby schools including Randolph High School, Boston Higashi School, and Lighthouse Baptist Christian Academy.
Ownership History
Date
Name
Owned For
Owner Type
Purchase Details
Closed on
Oct 26, 2021
Sold by
Ransom Craig C
Bought by
Ransom Craig C and Mccallum Trilaina
Current Estimated Value
Home Financials for this Owner
Home Financials are based on the most recent Mortgage that was taken out on this home.
Original Mortgage
$210,000
Outstanding Balance
$136,861
Interest Rate
3.01%
Mortgage Type
Stand Alone Refi Refinance Of Original Loan
Estimated Equity
$707,614
Purchase Details
Closed on
Feb 12, 2004
Sold by
Holmes Yates C and Kelly Walter J
Bought by
Ransom Craig C
Home Financials for this Owner
Home Financials are based on the most recent Mortgage that was taken out on this home.
Original Mortgage
$337,500
Interest Rate
5.82%
Mortgage Type
Purchase Money Mortgage
Purchase Details
Closed on
Jan 25, 1993
Sold by
Livingston Nancy S
Bought by
Holmes Yates
Home Financials for this Owner
Home Financials are based on the most recent Mortgage that was taken out on this home.
Original Mortgage
$143,200
Interest Rate
8.15%
Mortgage Type
Purchase Money Mortgage
Create a Home Valuation Report for This Property
The Home Valuation Report is an in-depth analysis detailing your home's value as well as a comparison with similar homes in the area
Home Values in the Area
Average Home Value in this Area
Purchase History
| Date | Buyer | Sale Price | Title Company |
|---|---|---|---|
| Ransom Craig C | -- | None Available | |
| Ransom Craig C | -- | None Available | |
| Ransom Craig C | $375,000 | -- | |
| Ransom Craig C | $375,000 | -- | |
| Holmes Yates | $179,000 | -- | |
| Holmes Yates | $179,000 | -- |
Source: Public Records
Mortgage History
| Date | Status | Borrower | Loan Amount |
|---|---|---|---|
| Open | Ransom Craig C | $210,000 | |
| Closed | Ransom Craig C | $210,000 | |
| Previous Owner | Ransom Craig C | $337,500 | |
| Previous Owner | Holmes Yates | $143,200 |
Source: Public Records
Tax History Compared to Growth
Tax History
| Year | Tax Paid | Tax Assessment Tax Assessment Total Assessment is a certain percentage of the fair market value that is determined by local assessors to be the total taxable value of land and additions on the property. | Land | Improvement |
|---|---|---|---|---|
| 2025 | $8,769 | $755,300 | $260,300 | $495,000 |
| 2024 | $8,077 | $705,400 | $255,100 | $450,300 |
| 2023 | $7,507 | $621,400 | $232,000 | $389,400 |
| 2022 | $7,151 | $525,800 | $193,300 | $332,500 |
| 2021 | $7,564 | $511,800 | $161,000 | $350,800 |
| 2020 | $7,207 | $483,400 | $161,000 | $322,400 |
| 2019 | $6,793 | $453,500 | $153,500 | $300,000 |
| 2018 | $6,236 | $392,700 | $139,400 | $253,300 |
| 2017 | $6,114 | $377,900 | $132,700 | $245,200 |
| 2016 | $5,620 | $323,200 | $120,700 | $202,500 |
| 2015 | $5,479 | $302,700 | $114,900 | $187,800 |
Source: Public Records
Map
Nearby Homes
- 34 Petipas Ln Unit 36
- 34-36 Peptipas Ln
- 36 Petipas Ln Unit 1
- 35 Petipas Ln (Off Union)
- 31 Petipas Ln
- 100 Fernandez Cir
- 26 Petipas Ln
- 16 Fernandez Cir
- 8 Fernandez Cir
- 27 Petipas Ln
- 101 Fernandez Cir
- 13 Fernandez Cir
- 94 Fernandez Cir
- 20 Fernandez Cir
- 3 Roach Dr
- 9 Fernandez Cir
- 97 Fernandez Cir
- 22 Petipas Ln Unit 24
- 23 Petipas Ln
- 17 Fernandez Cir