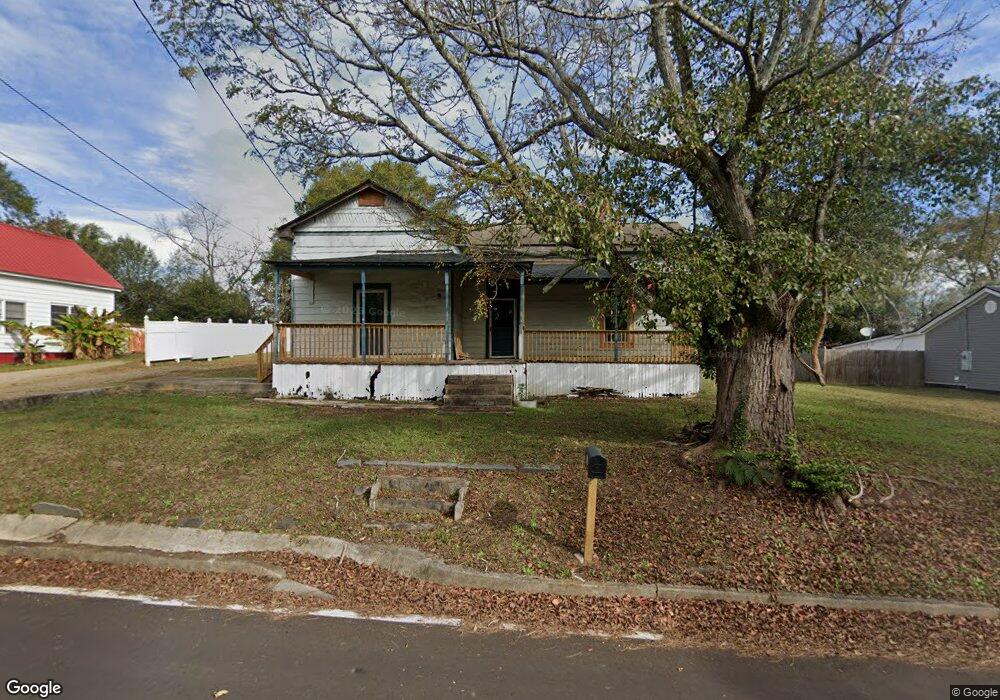
30 Reese St Elberton, GA 30635
Estimated Value: $108,000 - $182,000
--
Bed
1
Bath
1,348
Sq Ft
$100/Sq Ft
Est. Value
About This Home
This home is located at 30 Reese St, Elberton, GA 30635 and is currently estimated at $134,939, approximately $100 per square foot. 30 Reese St is a home located in Elbert County with nearby schools including Elbert County Primary School, Elbert County Elementary School, and Elbert County Middle School.
Ownership History
Date
Name
Owned For
Owner Type
Purchase Details
Closed on
Nov 11, 2021
Sold by
Imagine Construction Co Inc
Bought by
Passion Investment Properties Llc
Current Estimated Value
Home Financials for this Owner
Home Financials are based on the most recent Mortgage that was taken out on this home.
Original Mortgage
$55,000
Outstanding Balance
$48,707
Interest Rate
3.05%
Mortgage Type
New Conventional
Estimated Equity
$86,232
Purchase Details
Closed on
Jun 12, 2007
Sold by
Burton Gene
Bought by
Imagine Construction Co Inc
Purchase Details
Closed on
Apr 1, 1992
Purchase Details
Closed on
Apr 1, 1981
Purchase Details
Closed on
Feb 1, 1972
Purchase Details
Closed on
Jan 1, 1971
Purchase Details
Closed on
Feb 1, 1969
Create a Home Valuation Report for This Property
The Home Valuation Report is an in-depth analysis detailing your home's value as well as a comparison with similar homes in the area
Home Values in the Area
Average Home Value in this Area
Purchase History
| Date | Buyer | Sale Price | Title Company |
|---|---|---|---|
| Passion Investment Properties Llc | $65,000 | -- | |
| Imagine Construction Co Inc | $495,945 | -- | |
| -- | $6,500 | -- | |
| -- | $6,500 | -- | |
| -- | -- | -- | |
| -- | -- | -- | |
| -- | -- | -- |
Source: Public Records
Mortgage History
| Date | Status | Borrower | Loan Amount |
|---|---|---|---|
| Open | Passion Investment Properties Llc | $55,000 |
Source: Public Records
Tax History Compared to Growth
Tax History
| Year | Tax Paid | Tax Assessment Tax Assessment Total Assessment is a certain percentage of the fair market value that is determined by local assessors to be the total taxable value of land and additions on the property. | Land | Improvement |
|---|---|---|---|---|
| 2024 | $575 | $23,373 | $5,025 | $18,348 |
| 2023 | $575 | $23,373 | $5,025 | $18,348 |
| 2022 | $311 | $17,724 | $5,025 | $12,699 |
| 2021 | $439 | $17,724 | $5,025 | $12,699 |
| 2020 | $425 | $15,412 | $5,584 | $9,828 |
| 2019 | $439 | $15,412 | $5,584 | $9,828 |
| 2018 | $498 | $17,101 | $5,584 | $11,517 |
| 2017 | $438 | $13,930 | $5,584 | $8,346 |
| 2016 | $409 | $13,930 | $5,584 | $8,346 |
| 2015 | -- | $13,930 | $5,584 | $8,346 |
| 2014 | -- | $15,608 | $5,584 | $10,025 |
| 2013 | -- | $15,608 | $5,584 | $10,025 |
Source: Public Records
Map
Nearby Homes
- 345 N Oliver St
- 346 N Oliver St
- 44 Clairmont Ave
- 243 W Tate St
- 89 College Ave
- 968 Ext Elbert St
- 1020 Hickory Dr
- 0 Sara Jane Dr Unit 10501253
- 105 S Thomas St
- 136 Forest Ave
- 62 Oak St
- 214 Campbell St
- 0 Pulliam St Unit 7659662
- 0 Pulliam St Unit 10616872
- 108 Brookhaven Cir
- 1061 Porter Dr
- 120 S Tusten St
- 2790 Cedar Creek Rd
- 118 Oak Dr
- 170 Lake Forest Dr