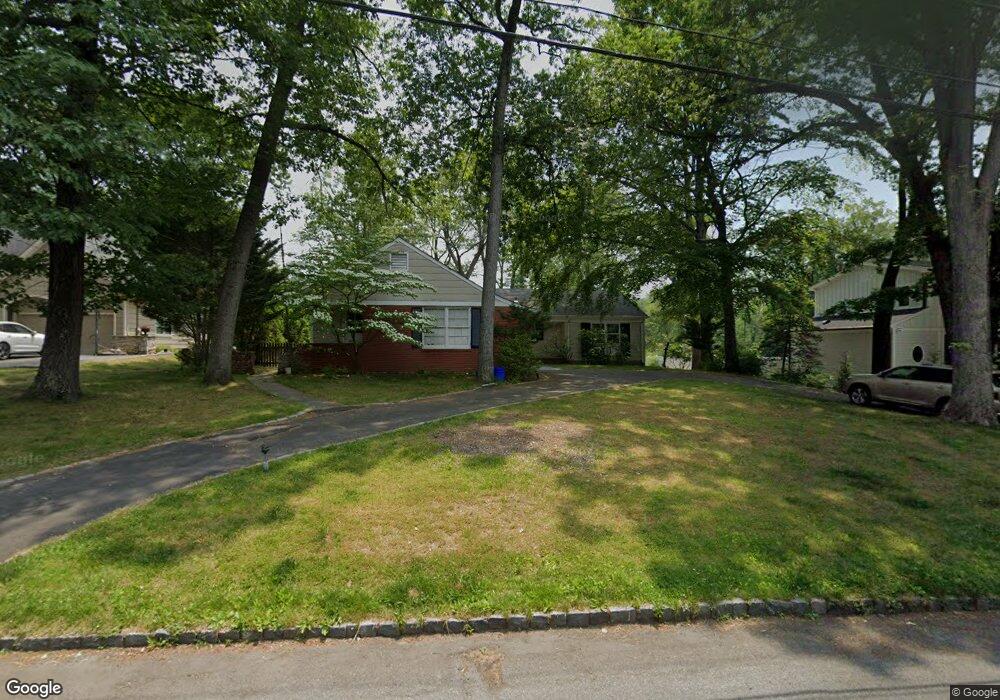
30 Richard Dr Short Hills, NJ 07078
Estimated Value: $1,773,000 - $2,300,154
--
Bed
--
Bath
2,708
Sq Ft
$744/Sq Ft
Est. Value
About This Home
This home is located at 30 Richard Dr, Short Hills, NJ 07078 and is currently estimated at $2,013,718, approximately $743 per square foot. 30 Richard Dr is a home located in Essex County with nearby schools including Deerfield Elementary School, Millburn Middle School, and Millburn High School.
Ownership History
Date
Name
Owned For
Owner Type
Purchase Details
Closed on
Dec 28, 2006
Sold by
Lehman Joan
Bought by
Zhu Chengdong and Jiang Nihal
Current Estimated Value
Home Financials for this Owner
Home Financials are based on the most recent Mortgage that was taken out on this home.
Original Mortgage
$680,000
Interest Rate
6.4%
Mortgage Type
New Conventional
Create a Home Valuation Report for This Property
The Home Valuation Report is an in-depth analysis detailing your home's value as well as a comparison with similar homes in the area
Home Values in the Area
Average Home Value in this Area
Purchase History
| Date | Buyer | Sale Price | Title Company |
|---|---|---|---|
| Zhu Chengdong | $850,000 | -- |
Source: Public Records
Mortgage History
| Date | Status | Borrower | Loan Amount |
|---|---|---|---|
| Previous Owner | Zhu Chengdong | $680,000 |
Source: Public Records
Tax History Compared to Growth
Tax History
| Year | Tax Paid | Tax Assessment Tax Assessment Total Assessment is a certain percentage of the fair market value that is determined by local assessors to be the total taxable value of land and additions on the property. | Land | Improvement |
|---|---|---|---|---|
| 2025 | $20,538 | $1,050,000 | $752,800 | $297,200 |
| 2024 | $20,538 | $1,050,000 | $752,800 | $297,200 |
| 2022 | $20,402 | $1,050,000 | $752,800 | $297,200 |
| 2021 | $20,349 | $1,050,000 | $752,800 | $297,200 |
| 2020 | $20,223 | $1,050,000 | $752,800 | $297,200 |
| 2019 | $20,265 | $1,050,000 | $752,800 | $297,200 |
| 2018 | $19,971 | $1,050,000 | $752,800 | $297,200 |
| 2017 | $21,041 | $1,133,700 | $792,800 | $340,900 |
| 2016 | $18,309 | $850,000 | $497,100 | $352,900 |
| 2015 | $17,893 | $850,000 | $497,100 | $352,900 |
| 2014 | $17,136 | $850,000 | $497,100 | $352,900 |
Source: Public Records
Map
Nearby Homes
- 148 Great Hills Rd
- 81 Athens Rd
- 496 White Oak Ridge Rd
- 55 Troy Dr
- 470 White Oak Ridge Rd
- 466 White Oak Ridge Rd
- 400 Old Short Hills Rd
- 18 Deer Path
- 44 W Beechcroft Rd
- 14 Putnam Rd
- 126 Fairfield Dr
- 463 Old Short Hills Rd
- 467 Old Short Hills Rd
- 8 Vanderbilt Dr
- 71 Cayuga Way
- 293 Old Short Hills Rd
- 18 S Beechcroft Rd
- 11 Hamilton Rd
- 24 Seminole Way
- 882 S Orange Ave