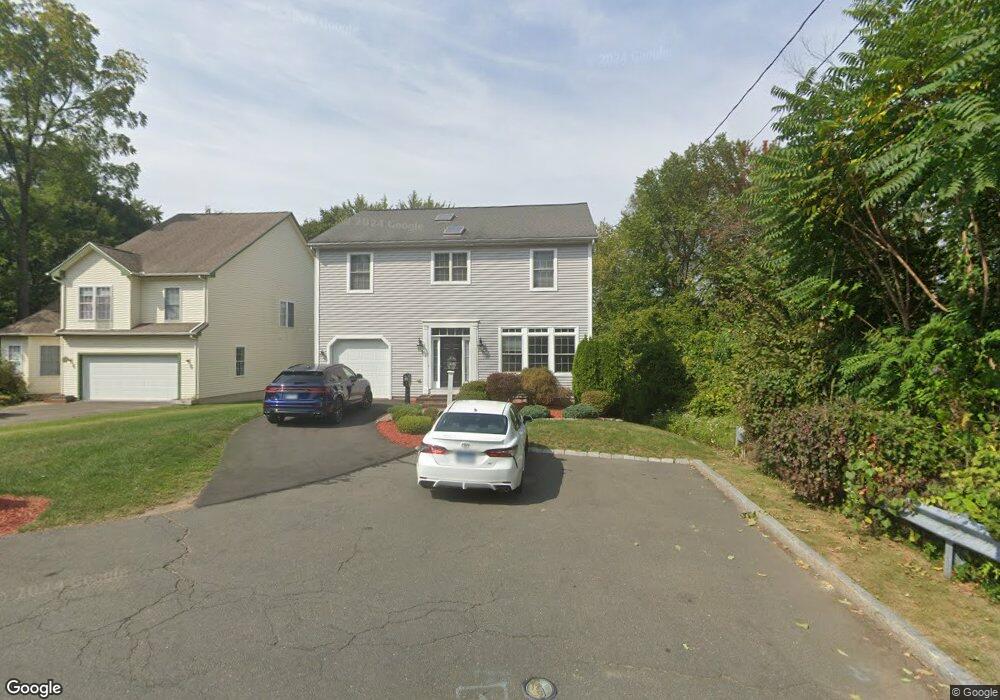
30 Roberts Ln West Hartford, CT 06107
Estimated Value: $624,000 - $793,467
3
Beds
4
Baths
2,264
Sq Ft
$321/Sq Ft
Est. Value
About This Home
This home is located at 30 Roberts Ln, West Hartford, CT 06107 and is currently estimated at $727,367, approximately $321 per square foot. 30 Roberts Ln is a home located in Hartford County with nearby schools including Braeburn School, Sedgwick Middle School, and Conard High School.
Ownership History
Date
Name
Owned For
Owner Type
Purchase Details
Closed on
May 31, 2024
Sold by
Onukwugha Emeka O
Bought by
Onukwugha Phinah I and Onukwugha Emeka O
Current Estimated Value
Purchase Details
Closed on
Aug 11, 2005
Sold by
New Home Building Svc
Bought by
Onukwugha Emeka O
Home Financials for this Owner
Home Financials are based on the most recent Mortgage that was taken out on this home.
Original Mortgage
$360,000
Interest Rate
4.75%
Purchase Details
Closed on
Dec 22, 2003
Sold by
Linslex Equities Inc
Bought by
New Home Building Svcs
Purchase Details
Closed on
Jul 15, 1994
Sold by
Jerome Patricia B
Bought by
Derocher Donna
Create a Home Valuation Report for This Property
The Home Valuation Report is an in-depth analysis detailing your home's value as well as a comparison with similar homes in the area
Home Values in the Area
Average Home Value in this Area
Purchase History
| Date | Buyer | Sale Price | Title Company |
|---|---|---|---|
| Onukwugha Phinah I | -- | None Available | |
| Onukwugha Phinah I | -- | None Available | |
| Onukwugha Emeka O | $455,756 | -- | |
| New Home Building Svcs | $85,000 | -- | |
| Derocher Donna | $55,000 | -- | |
| Onukwugha Emeka O | $455,756 | -- | |
| New Home Building Svcs | $85,000 | -- | |
| Derocher Donna | $55,000 | -- |
Source: Public Records
Mortgage History
| Date | Status | Borrower | Loan Amount |
|---|---|---|---|
| Previous Owner | Derocher Donna | $61,000 | |
| Previous Owner | Derocher Donna | $360,000 |
Source: Public Records
Tax History Compared to Growth
Tax History
| Year | Tax Paid | Tax Assessment Tax Assessment Total Assessment is a certain percentage of the fair market value that is determined by local assessors to be the total taxable value of land and additions on the property. | Land | Improvement |
|---|---|---|---|---|
| 2025 | $15,476 | $345,590 | $123,200 | $222,390 |
| 2024 | $14,636 | $345,590 | $123,200 | $222,390 |
| 2023 | $14,142 | $345,590 | $123,200 | $222,390 |
| 2022 | $14,059 | $345,590 | $123,200 | $222,390 |
| 2021 | $13,140 | $309,750 | $118,090 | $191,660 |
| 2020 | $12,752 | $305,060 | $110,110 | $194,950 |
| 2019 | $12,752 | $305,060 | $110,110 | $194,950 |
| 2018 | $12,507 | $305,060 | $110,110 | $194,950 |
| 2017 | $12,520 | $305,060 | $110,110 | $194,950 |
| 2016 | $10,770 | $272,580 | $94,920 | $177,660 |
| 2015 | $10,443 | $272,580 | $94,920 | $177,660 |
| 2014 | $10,186 | $272,580 | $94,920 | $177,660 |
Source: Public Records
Map
Nearby Homes
- 57 Wardwell Rd
- 269 Mountain Rd
- 51 Lemay St
- 50 Tunxis Rd
- 41 Soby Dr
- 43 Spring Ln
- 11 Fairwood Farms Dr
- 37 W Normandy Dr
- 47 Hillsboro Dr
- 29 Fairwood Farms Dr
- 25 Ellsworth Rd
- 2 Arapahoe Rd Unit 313
- 2 Arapahoe Rd Unit 308
- 2 Arapahoe Rd Unit 611
- 2 Arapahoe Rd Unit 601
- 2 Arapahoe Rd Unit 510
- 2 Arapahoe Rd Unit 505
- 2 Arapahoe Rd Unit 604
- 2 Arapahoe Rd Unit 609
- 2 Arapahoe Rd Unit 607
- 21 Gloucester Ln
- 34 Roberts Ln
- 19 Gloucester Ln
- 23 Gloucester Ln
- 38 Roberts Ln
- 17 Gloucester Ln
- 31 Roberts Ln
- 35 Roberts Ln
- 14 Gloucester Ln
- 15 Gloucester Ln
- 25 Gloucester Ln
- 12 Gloucester Ln
- 27 Roberts Ln
- 42 Roberts Ln
- 37 Roberts Ln
- 9 Gloucester Ln
- 16 Gloucester Ln
- 31 Gloucester Ln
- 8 Gloucester Ln
- 1182 Farmington Ave