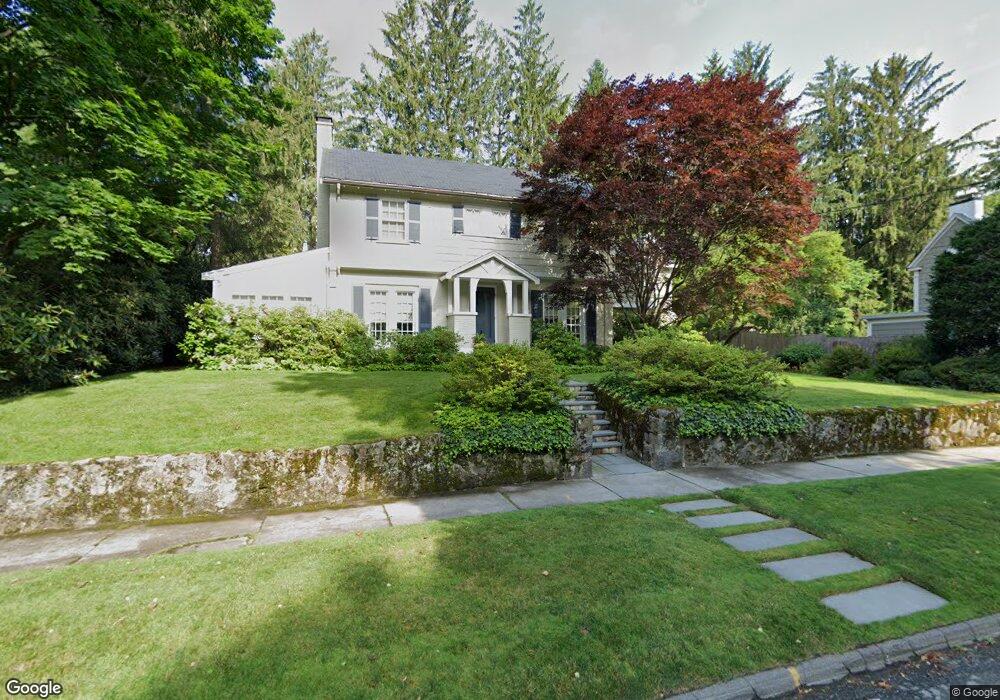
30 Rosalie Rd Newton Center, MA 02459
Oak Hill NeighborhoodEstimated Value: $1,816,444 - $2,044,000
5
Beds
3
Baths
2,929
Sq Ft
$655/Sq Ft
Est. Value
About This Home
This home is located at 30 Rosalie Rd, Newton Center, MA 02459 and is currently estimated at $1,917,361, approximately $654 per square foot. 30 Rosalie Rd is a home located in Middlesex County with nearby schools including Memorial Spaulding Elementary School, Oak Hill Middle School, and Newton South High School.
Ownership History
Date
Name
Owned For
Owner Type
Purchase Details
Closed on
Sep 27, 1989
Sold by
Cole Aaron H
Bought by
Douglass Joshua Y
Current Estimated Value
Create a Home Valuation Report for This Property
The Home Valuation Report is an in-depth analysis detailing your home's value as well as a comparison with similar homes in the area
Home Values in the Area
Average Home Value in this Area
Purchase History
| Date | Buyer | Sale Price | Title Company |
|---|---|---|---|
| Douglass Joshua Y | $352,500 | -- |
Source: Public Records
Mortgage History
| Date | Status | Borrower | Loan Amount |
|---|---|---|---|
| Open | Douglass Joshua Y | $405,000 | |
| Closed | Douglass Joshua Y | $523,750 |
Source: Public Records
Tax History Compared to Growth
Tax History
| Year | Tax Paid | Tax Assessment Tax Assessment Total Assessment is a certain percentage of the fair market value that is determined by local assessors to be the total taxable value of land and additions on the property. | Land | Improvement |
|---|---|---|---|---|
| 2025 | $14,341 | $1,463,400 | $1,062,100 | $401,300 |
| 2024 | $13,867 | $1,420,800 | $1,031,200 | $389,600 |
| 2023 | $13,305 | $1,307,000 | $797,600 | $509,400 |
| 2022 | $12,731 | $1,210,200 | $738,500 | $471,700 |
| 2021 | $12,285 | $1,141,700 | $696,700 | $445,000 |
| 2020 | $11,919 | $1,141,700 | $696,700 | $445,000 |
| 2019 | $11,583 | $1,108,400 | $676,400 | $432,000 |
| 2018 | $11,399 | $1,053,500 | $620,100 | $433,400 |
| 2017 | $11,052 | $993,900 | $585,000 | $408,900 |
| 2016 | $10,571 | $928,900 | $546,700 | $382,200 |
| 2015 | $10,079 | $868,100 | $510,900 | $357,200 |
Source: Public Records
Map
Nearby Homes
- 36 Ober Rd
- 135 Hartman Rd
- 58 Country Club Rd
- 44 Lovett Rd
- 41 Juniper Ln
- 65 Levbert Rd
- 21 Lovett Rd
- 59 Deborah Rd
- 63 Drumlin Rd
- 853 Dedham St
- 207 Nahanton St Unit 207
- 56 Cynthia Rd
- 415 Dedham St Unit D
- 210 Nahanton St Unit 404
- 396 Dedham St
- 99 Baldpate Hill Rd
- 22 Nightingale Path
- 15 Buff Cir
- 133 Oak Hill St
- 544 Saw Mill Brook Pkwy