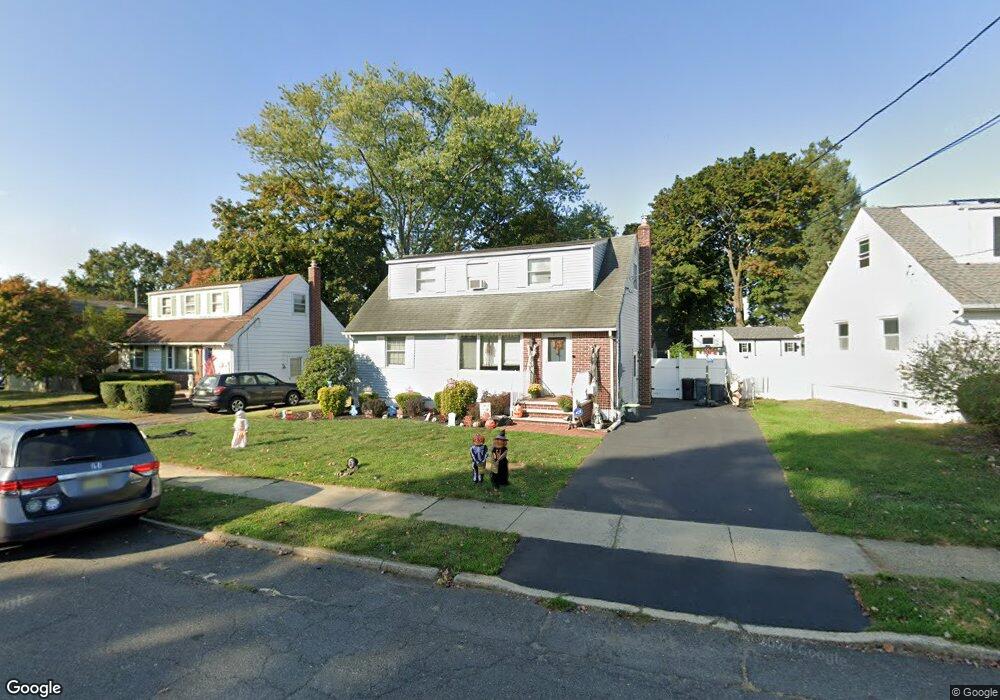
30 Runyon Ave Freehold, NJ 07728
Estimated Value: $490,000 - $548,000
3
Beds
2
Baths
1,344
Sq Ft
$388/Sq Ft
Est. Value
About This Home
This home is located at 30 Runyon Ave, Freehold, NJ 07728 and is currently estimated at $521,106, approximately $387 per square foot. 30 Runyon Ave is a home located in Monmouth County with nearby schools including Park Avenue Elementary School, Freehold Intermediate School, and Freehold Borough High School.
Ownership History
Date
Name
Owned For
Owner Type
Purchase Details
Closed on
May 27, 2016
Sold by
Fahrion Jacqueline and Wines Patricia Wines
Bought by
Fahrion James and Fahrion Jacqueline
Current Estimated Value
Home Financials for this Owner
Home Financials are based on the most recent Mortgage that was taken out on this home.
Interest Rate
3.64%
Purchase Details
Closed on
Dec 8, 2008
Sold by
Sanchez Romana and Albarran Alberto
Bought by
Fahrion James and Wines Patricia
Home Financials for this Owner
Home Financials are based on the most recent Mortgage that was taken out on this home.
Original Mortgage
$266,483
Interest Rate
6.49%
Mortgage Type
FHA
Purchase Details
Closed on
May 24, 2005
Sold by
Csapo Daniel
Bought by
Sanchez Romana
Home Financials for this Owner
Home Financials are based on the most recent Mortgage that was taken out on this home.
Original Mortgage
$275,920
Interest Rate
6.75%
Mortgage Type
Adjustable Rate Mortgage/ARM
Create a Home Valuation Report for This Property
The Home Valuation Report is an in-depth analysis detailing your home's value as well as a comparison with similar homes in the area
Home Values in the Area
Average Home Value in this Area
Purchase History
| Date | Buyer | Sale Price | Title Company |
|---|---|---|---|
| Fahrion James | -- | -- | |
| Fahrion James | $270,000 | None Available | |
| Sanchez Romana | $344,900 | -- |
Source: Public Records
Mortgage History
| Date | Status | Borrower | Loan Amount |
|---|---|---|---|
| Closed | Fahrion James | -- | |
| Previous Owner | Fahrion James | $266,483 | |
| Previous Owner | Sanchez Romana | $275,920 |
Source: Public Records
Tax History
| Year | Tax Paid | Tax Assessment Tax Assessment Total Assessment is a certain percentage of the fair market value that is determined by local assessors to be the total taxable value of land and additions on the property. | Land | Improvement |
|---|---|---|---|---|
| 2025 | $8,207 | $458,800 | $290,600 | $168,200 |
| 2024 | $8,671 | $408,900 | $243,800 | $165,100 |
| 2023 | $8,671 | $413,500 | $252,300 | $161,200 |
| 2022 | $7,381 | $325,800 | $179,000 | $146,800 |
| 2021 | $7,381 | $281,400 | $149,100 | $132,300 |
| 2020 | $7,328 | $275,300 | $149,100 | $126,200 |
| 2019 | $7,195 | $271,500 | $149,100 | $122,400 |
| 2018 | $7,271 | $269,200 | $149,100 | $120,100 |
| 2017 | $6,986 | $257,600 | $139,100 | $118,500 |
| 2016 | $6,715 | $252,900 | $138,300 | $114,600 |
| 2015 | $6,289 | $248,200 | $133,600 | $114,600 |
| 2014 | $6,730 | $278,200 | $163,600 | $114,600 |
Source: Public Records
Map
Nearby Homes
Your Personal Tour Guide
Ask me questions while you tour the home.