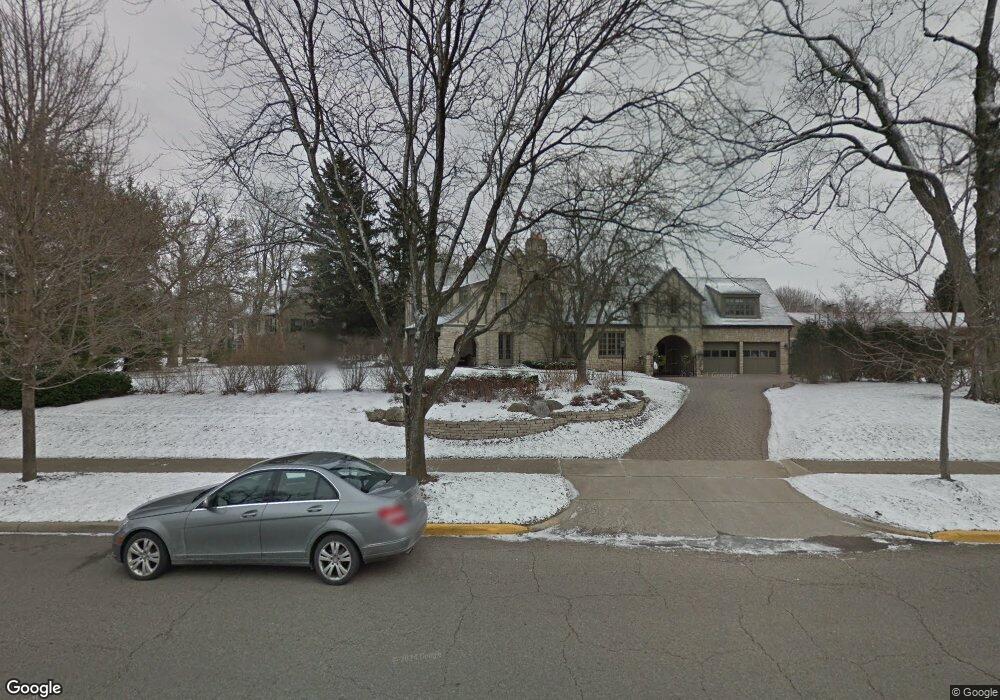
30 S Drexel Ave Columbus, OH 43209
Estimated Value: $1,575,000 - $1,695,000
5
Beds
5
Baths
5,000
Sq Ft
$325/Sq Ft
Est. Value
About This Home
This home is located at 30 S Drexel Ave, Columbus, OH 43209 and is currently estimated at $1,623,767, approximately $324 per square foot. 30 S Drexel Ave is a home located in Franklin County with nearby schools including Cassingham Elementary School, Bexley Middle School, and Bexley High School.
Ownership History
Date
Name
Owned For
Owner Type
Purchase Details
Closed on
Apr 13, 2021
Sold by
Spiess Amy M
Bought by
Spiess Aaron J
Current Estimated Value
Purchase Details
Closed on
Jul 30, 2015
Sold by
Spiess Aaron J and Spiess Amy M
Bought by
Spiess Amy M and The Amy M Spiess Trust
Purchase Details
Closed on
Nov 11, 2005
Sold by
Hoffman Rebecca D
Bought by
Spiess Aaron J and Spiess Amy M
Home Financials for this Owner
Home Financials are based on the most recent Mortgage that was taken out on this home.
Original Mortgage
$350,000
Outstanding Balance
$186,466
Interest Rate
5.98%
Mortgage Type
Fannie Mae Freddie Mac
Estimated Equity
$1,437,301
Purchase Details
Closed on
Aug 3, 2000
Sold by
Gerhold Edward
Bought by
Hoffman Rebecca D
Purchase Details
Closed on
Apr 14, 1993
Bought by
Murnane Rhonda S
Purchase Details
Closed on
Jun 1, 1987
Purchase Details
Closed on
Apr 1, 1977
Create a Home Valuation Report for This Property
The Home Valuation Report is an in-depth analysis detailing your home's value as well as a comparison with similar homes in the area
Home Values in the Area
Average Home Value in this Area
Purchase History
| Date | Buyer | Sale Price | Title Company |
|---|---|---|---|
| Spiess Aaron J | -- | None Available | |
| Spiess Amy M | -- | None Available | |
| Spiess Amy M | -- | Attorney | |
| Spiess Aaron J | $738,000 | Ohio Title | |
| Hoffman Rebecca D | -- | Benchmark Title Agency Inc | |
| Gerhold Edward | $800,000 | Benchmark Title Agency Inc | |
| Murnane Rhonda S | -- | -- | |
| -- | $249,500 | -- | |
| -- | $100,000 | -- |
Source: Public Records
Mortgage History
| Date | Status | Borrower | Loan Amount |
|---|---|---|---|
| Open | Spiess Aaron J | $350,000 |
Source: Public Records
Tax History
| Year | Tax Paid | Tax Assessment Tax Assessment Total Assessment is a certain percentage of the fair market value that is determined by local assessors to be the total taxable value of land and additions on the property. | Land | Improvement |
|---|---|---|---|---|
| 2025 | $25,963 | $467,530 | $147,000 | $320,530 |
| 2024 | $25,963 | $467,530 | $147,000 | $320,530 |
| 2023 | $23,343 | $467,530 | $147,000 | $320,530 |
| 2022 | $22,257 | $358,020 | $88,550 | $269,470 |
| 2021 | $22,275 | $358,020 | $88,550 | $269,470 |
| 2020 | $22,079 | $358,020 | $88,550 | $269,470 |
| 2019 | $22,717 | $324,100 | $80,500 | $243,600 |
| 2018 | $19,617 | $322,070 | $80,500 | $241,570 |
| 2017 | $19,353 | $322,070 | $80,500 | $241,570 |
| 2016 | $19,563 | $300,760 | $77,910 | $222,850 |
| 2015 | $19,620 | $300,760 | $77,910 | $222,850 |
| 2014 | $19,732 | $300,760 | $77,910 | $222,850 |
| 2013 | $9,324 | $273,420 | $70,840 | $202,580 |
Source: Public Records
Map
Nearby Homes
- 2465 E Broad St
- 52 N Ardmore Rd
- 103 N Ardmore Rd
- 57 Preston Rd
- 271 S Cassingham Rd
- 125 S Stanwood Rd
- 2417 Fair Ave
- 2731 E Broad St
- 211 Preston Rd
- 343 N Cassady Ave
- 291 Sherborne Dr
- 41 S Broadleigh Rd
- 484 N Parkview Ave
- 161 N Gould Rd
- 1994 Stratford Way
- 2779 Columbus Ave
- 205 N Gould Rd
- 50 S Chesterfield Rd
- 1847 Oak St
- 2822 Bellwood Ave
- 20 S Drexel Ave
- 48 S Drexel Ave
- 60 S Drexel Ave
- 51 S Dawson Ave
- 43 S Dawson Ave
- 10 S Drexel Ave
- 57 S Dawson Ave
- 35 S Dawson Ave
- 63 S Dawson Ave
- 65 S Drexel Ave
- 78 S Drexel Ave
- 69 S Dawson Ave
- 2445 E Broad St
- 79 S Dawson Ave
- 1 S Dawson Ave
- 88 S Drexel Ave
- 89 S Dawson Ave
- 97 S Dawson Ave
- 42 S Dawson Ave
- 50 S Dawson Ave
Your Personal Tour Guide
Ask me questions while you tour the home.