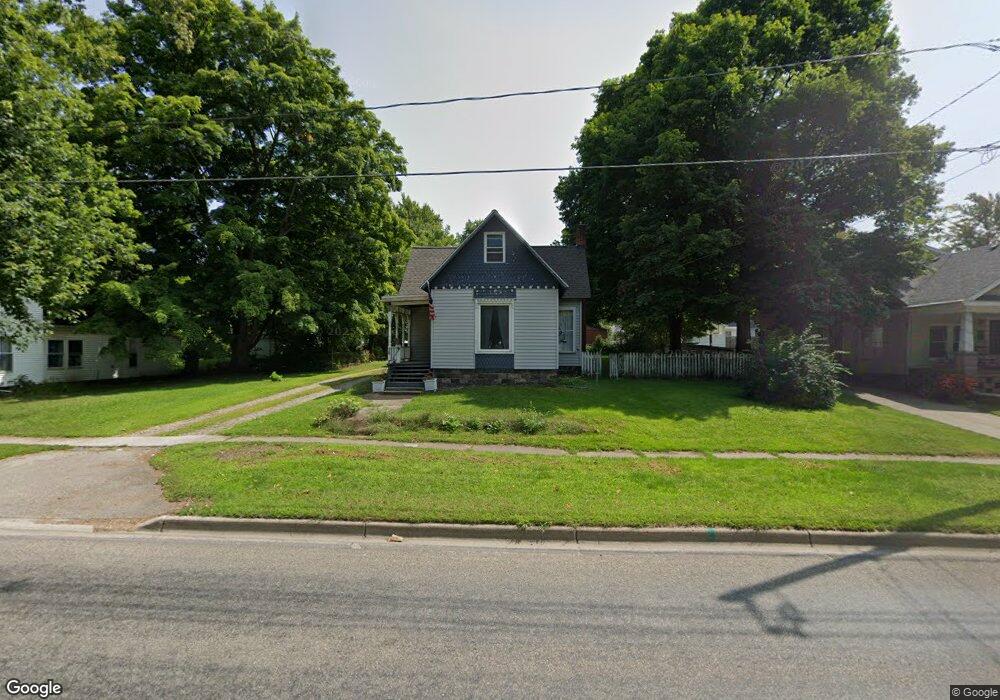
30 S Main St Quincy, MI 49082
Estimated Value: $155,672 - $171,000
3
Beds
1
Bath
1,404
Sq Ft
$115/Sq Ft
Est. Value
About This Home
This home is located at 30 S Main St, Quincy, MI 49082 and is currently estimated at $161,918, approximately $115 per square foot. 30 S Main St is a home located in Branch County with nearby schools including Jennings Elementary School, Quincy Middle School, and Quincy High School.
Ownership History
Date
Name
Owned For
Owner Type
Purchase Details
Closed on
May 31, 2013
Sold by
Ochsenrider Lindsay and Ochsenrider Charles
Bought by
Crandall Richele
Current Estimated Value
Home Financials for this Owner
Home Financials are based on the most recent Mortgage that was taken out on this home.
Original Mortgage
$58,673
Outstanding Balance
$41,457
Interest Rate
3.34%
Mortgage Type
New Conventional
Estimated Equity
$120,461
Purchase Details
Closed on
Nov 16, 2009
Sold by
Member First Mortgage Llc
Bought by
Federal National Mortgage Association
Purchase Details
Closed on
Nov 12, 2009
Sold by
Farris Jessica L and Credit Union Mortgage Company
Bought by
Member First Mortgage Llc
Purchase Details
Closed on
Feb 24, 1998
Purchase Details
Closed on
Sep 25, 1993
Sold by
Gentry Gerald G and Gentry Joyce A
Bought by
Robosky William and Robosky Patricia
Create a Home Valuation Report for This Property
The Home Valuation Report is an in-depth analysis detailing your home's value as well as a comparison with similar homes in the area
Purchase History
| Date | Buyer | Sale Price | Title Company |
|---|---|---|---|
| Crandall Richele | $57,500 | None Available | |
| Federal National Mortgage Association | -- | None Available | |
| Member First Mortgage Llc | $76,142 | None Available | |
| -- | $34,500 | -- | |
| Robosky William | $34,500 | -- |
Source: Public Records
Mortgage History
| Date | Status | Borrower | Loan Amount |
|---|---|---|---|
| Open | Crandall Richele | $58,673 |
Source: Public Records
Tax History
| Year | Tax Paid | Tax Assessment Tax Assessment Total Assessment is a certain percentage of the fair market value that is determined by local assessors to be the total taxable value of land and additions on the property. | Land | Improvement |
|---|---|---|---|---|
| 2025 | $1,573 | $59,463 | $0 | $0 |
| 2024 | $8 | $53,491 | $0 | $0 |
| 2023 | $782 | $48,846 | $0 | $0 |
| 2022 | $782 | $45,713 | $0 | $0 |
| 2020 | -- | $44,292 | $0 | $0 |
| 2019 | -- | $36,129 | $0 | $0 |
| 2018 | -- | $33,073 | $0 | $0 |
| 2017 | -- | $31,931 | $0 | $0 |
| 2016 | -- | $26,602 | $0 | $0 |
| 2015 | -- | $27,291 | $0 | $0 |
| 2014 | -- | $26,009 | $0 | $0 |
| 2013 | -- | $26,323 | $0 | $0 |
Source: Public Records
Map
Nearby Homes
- 8 Hunting Trail Ave
- 46 W Chicago St
- 64 E Jefferson St
- 29 Broughton St
- 1085 E Chicago Rd
- 1085 E Chicago Rd Unit B
- 1085 E Chicago Rd Unit A
- 437 Richard St
- 493 Richard St
- 201 Wildwood Beach Rd
- 0 Wildwood Rd
- 981 Generic Dr
- 345 N Fremont Rd
- 808 Rolling Meadows Dr
- 944 Lukesport Rd
- 147 Dons Dr
- 0 Lott Rd
- VL N Fiske Rd
- 410 N Fiske Rd
- 181 Dons Dr
Your Personal Tour Guide
Ask me questions while you tour the home.