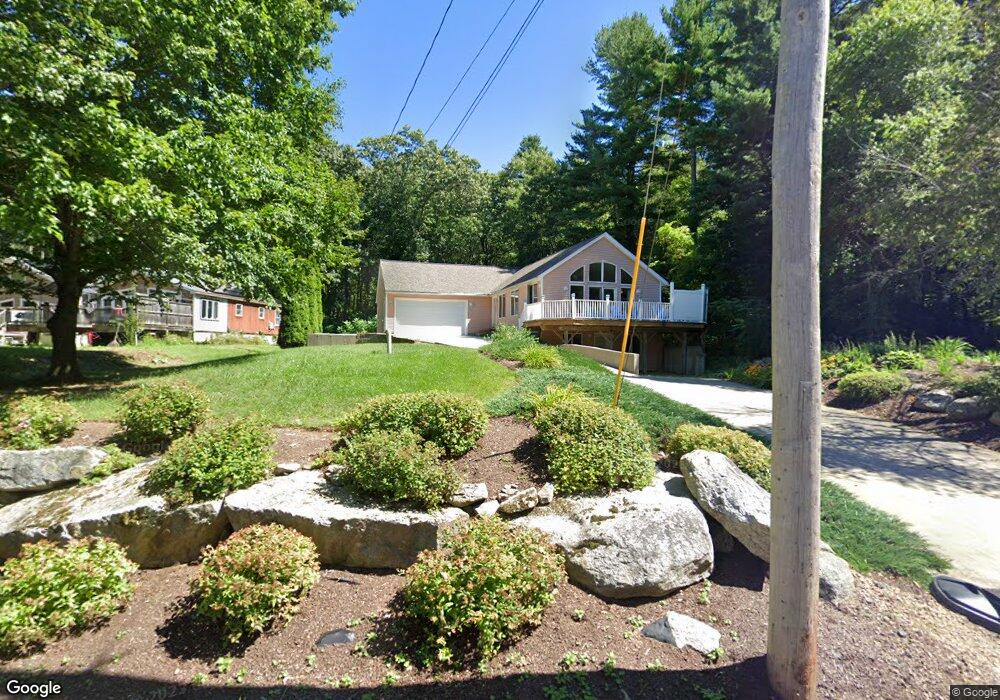
30 Salminen Dr Leicester, MA 01524
Estimated Value: $455,000 - $596,000
2
Beds
2
Baths
2,067
Sq Ft
$258/Sq Ft
Est. Value
About This Home
This home is located at 30 Salminen Dr, Leicester, MA 01524 and is currently estimated at $533,523, approximately $258 per square foot. 30 Salminen Dr is a home located in Worcester County with nearby schools including Leicester Integrated Preschool, Leicester Memorial Elementary School, and Leicester Middle School.
Ownership History
Date
Name
Owned For
Owner Type
Purchase Details
Closed on
Dec 23, 2009
Sold by
Fnma
Bought by
White Melissa G
Current Estimated Value
Home Financials for this Owner
Home Financials are based on the most recent Mortgage that was taken out on this home.
Original Mortgage
$152,625
Outstanding Balance
$99,250
Interest Rate
4.92%
Mortgage Type
Purchase Money Mortgage
Estimated Equity
$434,273
Purchase Details
Closed on
Jul 2, 2008
Sold by
Tefft Scott D and Tefft Tina M
Bought by
Federal National Mortgage Association
Purchase Details
Closed on
Sep 20, 2002
Sold by
Paulin Jeffrey
Bought by
Tefft Scott D and Tefft Tina M
Purchase Details
Closed on
Nov 25, 1998
Sold by
Carlson John L and Carlson Richard J
Bought by
Paulin Jeffrey and Kowal Patricia
Create a Home Valuation Report for This Property
The Home Valuation Report is an in-depth analysis detailing your home's value as well as a comparison with similar homes in the area
Home Values in the Area
Average Home Value in this Area
Purchase History
| Date | Buyer | Sale Price | Title Company |
|---|---|---|---|
| White Melissa G | $165,000 | -- | |
| White Melissa G | $165,000 | -- | |
| White Melissa G | $165,000 | -- | |
| Federal National Mortgage Association | $401,697 | -- | |
| Federal National Mortgage Association | $401,697 | -- | |
| Federal National Mortgage Association | $401,697 | -- | |
| Tefft Scott D | $240,000 | -- | |
| Tefft Scott D | $240,000 | -- | |
| Paulin Jeffrey | $16,000 | -- | |
| Paulin Jeffrey | $16,000 | -- |
Source: Public Records
Mortgage History
| Date | Status | Borrower | Loan Amount |
|---|---|---|---|
| Closed | Paulin Jeffrey | $13,200 | |
| Open | White Melissa G | $152,625 | |
| Closed | White Melissa G | $152,625 |
Source: Public Records
Tax History Compared to Growth
Tax History
| Year | Tax Paid | Tax Assessment Tax Assessment Total Assessment is a certain percentage of the fair market value that is determined by local assessors to be the total taxable value of land and additions on the property. | Land | Improvement |
|---|---|---|---|---|
| 2025 | $53 | $452,200 | $73,500 | $378,700 |
| 2024 | $5,074 | $404,300 | $63,600 | $340,700 |
| 2023 | $4,807 | $373,800 | $63,600 | $310,200 |
| 2022 | $4,625 | $330,600 | $60,800 | $269,800 |
| 2021 | $4,839 | $319,800 | $60,800 | $259,000 |
| 2020 | $4,328 | $290,300 | $55,700 | $234,600 |
| 2019 | $4,152 | $275,300 | $50,000 | $225,300 |
| 2018 | $3,957 | $245,900 | $50,000 | $195,900 |
| 2017 | $3,759 | $242,800 | $50,000 | $192,800 |
| 2016 | $3,545 | $237,900 | $62,300 | $175,600 |
| 2015 | $3,459 | $237,900 | $62,300 | $175,600 |
Source: Public Records
Map
Nearby Homes
- 3 Flagg Dr
- 6 Williams Dr
- 20 Leela Ln
- 102 River St
- 25 Clark Rd
- 2 Wendy Place
- 6 Brickyard Rd
- 33 G h Wilson Rd
- 40 Lakeview Dr
- 68 Borkum Rd
- 2 Victor Ave
- 473 Pleasant St
- 10 Edward St
- 3 Edward St Unit 3
- Lot 3 Smith Rd
- Lot 5 Smith Rd
- Lot 4 Smith Rd
- 75 Huntoon Memorial Hwy Unit 1-2
- 27 W Applewood Dr
- 502 Pine St
- 28 Salminen Dr
- 32 Salminen Dr
- 29 Salminen Dr
- 26 Salminen Dr
- 27 Salminen Dr
- 33 Salminen Dr
- 13 Salminen Dr
- 21 Salminen Dr
- 12 Salminen Dr
- 40 Salminen Dr
- 15 Salminen Dr
- 39 Salminen Dr
- 37 Salminen Dr
- 2 Dolma Ln
- 19 Salminen Dr
- 25 Salminen Dr
- 24-26 Salminen Dr
- Lot-13 Salminen Dr
- 17 Salminen Dr
- 11 Salminen Dr