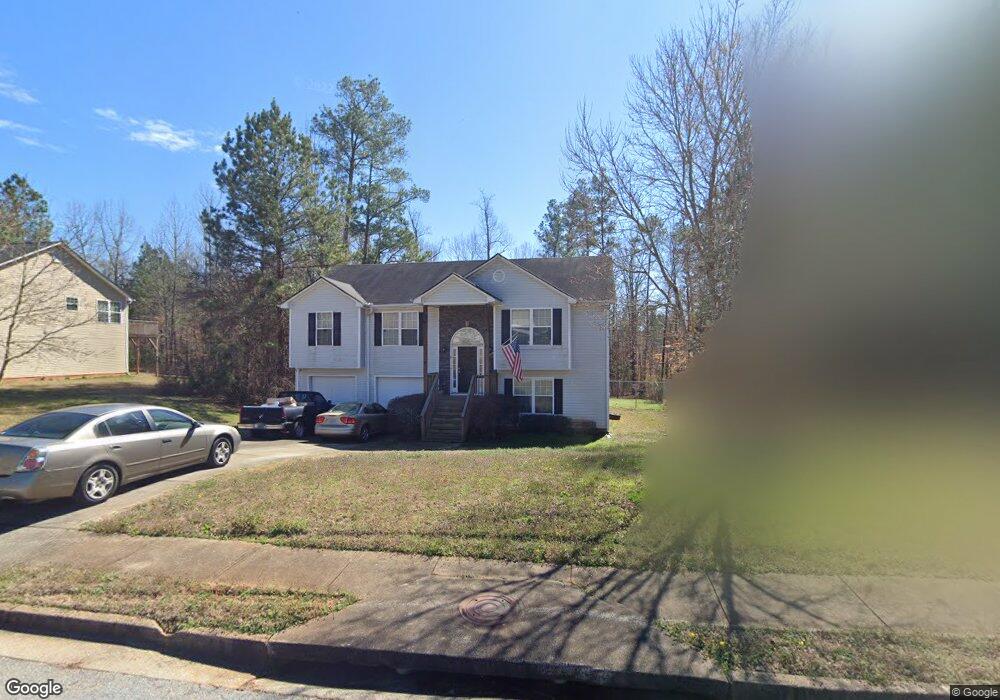
30 Shadowbrook Trace Covington, GA 30016
Estimated Value: $264,000 - $295,000
5
Beds
3
Baths
1,420
Sq Ft
$200/Sq Ft
Est. Value
About This Home
This home is located at 30 Shadowbrook Trace, Covington, GA 30016 and is currently estimated at $284,003, approximately $200 per square foot. 30 Shadowbrook Trace is a home located in Newton County with nearby schools including Rocky Plains Elementary School, Indian Creek Middle School, and Alcovy High School.
Ownership History
Date
Name
Owned For
Owner Type
Purchase Details
Closed on
May 5, 2022
Sold by
Armour Lottie Mae
Bought by
Piatt Christa Lynn and Piatt Keith Kenneth
Current Estimated Value
Purchase Details
Closed on
Oct 22, 2010
Sold by
Cwabs Inc Series 2006 & 12
Bought by
Armour Lottie M
Home Financials for this Owner
Home Financials are based on the most recent Mortgage that was taken out on this home.
Original Mortgage
$82,488
Interest Rate
4.5%
Mortgage Type
FHA
Purchase Details
Closed on
Dec 1, 2009
Sold by
Wells Stanford
Bought by
Cwabs Inc
Purchase Details
Closed on
May 9, 2006
Sold by
Riverwood Hm Bldrs Inc
Bought by
Wells Stanford
Home Financials for this Owner
Home Financials are based on the most recent Mortgage that was taken out on this home.
Original Mortgage
$130,050
Interest Rate
11.4%
Mortgage Type
New Conventional
Purchase Details
Closed on
Aug 10, 2005
Sold by
Homes By The Hills Inc
Bought by
Riverwood Hm Bldrs Inc
Create a Home Valuation Report for This Property
The Home Valuation Report is an in-depth analysis detailing your home's value as well as a comparison with similar homes in the area
Home Values in the Area
Average Home Value in this Area
Purchase History
| Date | Buyer | Sale Price | Title Company |
|---|---|---|---|
| Piatt Christa Lynn | -- | -- | |
| Armour Lottie M | $75,500 | -- | |
| Cwabs Inc | $78,750 | -- | |
| Wells Stanford | $153,000 | -- | |
| Riverwood Hm Bldrs Inc | $160,000 | -- |
Source: Public Records
Mortgage History
| Date | Status | Borrower | Loan Amount |
|---|---|---|---|
| Previous Owner | Armour Lottie M | $82,488 | |
| Previous Owner | Wells Stanford | $130,050 |
Source: Public Records
Tax History
| Year | Tax Paid | Tax Assessment Tax Assessment Total Assessment is a certain percentage of the fair market value that is determined by local assessors to be the total taxable value of land and additions on the property. | Land | Improvement |
|---|---|---|---|---|
| 2025 | $2,771 | $113,080 | $16,000 | $97,080 |
| 2024 | $2,921 | $117,080 | $18,800 | $98,280 |
| 2023 | $2,893 | $108,520 | $9,600 | $98,920 |
| 2022 | $1,360 | $77,200 | $9,600 | $67,600 |
| 2021 | $1,429 | $74,480 | $8,800 | $65,680 |
| 2020 | $1,223 | $64,080 | $6,000 | $58,080 |
| 2019 | $1,228 | $63,720 | $6,000 | $57,720 |
| 2018 | $975 | $56,120 | $6,000 | $50,120 |
| 2017 | $483 | $41,800 | $6,000 | $35,800 |
| 2016 | $505 | $42,440 | $3,800 | $38,640 |
| 2015 | $533 | $43,360 | $3,200 | $40,160 |
| 2014 | $177 | $33,040 | $0 | $0 |
Source: Public Records
Map
Nearby Homes
- 190 Shadowbrook Trace
- 200 Shadowbrook Trace
- 25 Shadowbrook Ct
- 145 Shadowbrook Trace Unit 2
- 85 Brittney Ln
- 230 Great Gorge Pkwy
- 60 Hazelnut Ct Unit 3
- 145 Clover Valley Dr Unit 4
- 140 Clover Valley Dr
- 45 Avery Dr Unit 1
- 35 Cashew Ct
- 65 Avery Dr
- 120 Lummus Rd
- 3355 Highway 162
- 402 Rocky Plains Rd
- 230 Barcelona Dr
- 153 Helen Rd
- 230 Oak Meadows Place
- 3282 Old Snapping Shoals Rd
- 245 Cypress Dr
- 40 Shadowbrook Trace Unit 1
- 20 Shadowbrook Trace
- 20 Shadowbrook Trace Unit 81
- 50 Shadowbrook Trace Unit 1
- 25 Shadowbrook Trace
- 10 Shadowbrook Trace
- 45 Shadowbrook Trace Unit 1
- 15 Shadowbrook Trace
- 75 Shadowbrook Ln Unit 1
- 60 Shadowbrook Trace
- 80 Shadowbrook Ln
- 65 Shadowbrook Ln
- 55 Shadowbrook Trace
- 70 Shadowbrook Trace Unit 2
- 70 Shadowbrook Ln
- 65 Shadowbrook Trace
- 60 Shadowbrook Ln
- 75 Shadowbrook Trace Unit 2
- 20 Shadowbrook Ct Unit 1
- 30 Shadowbrook Ct