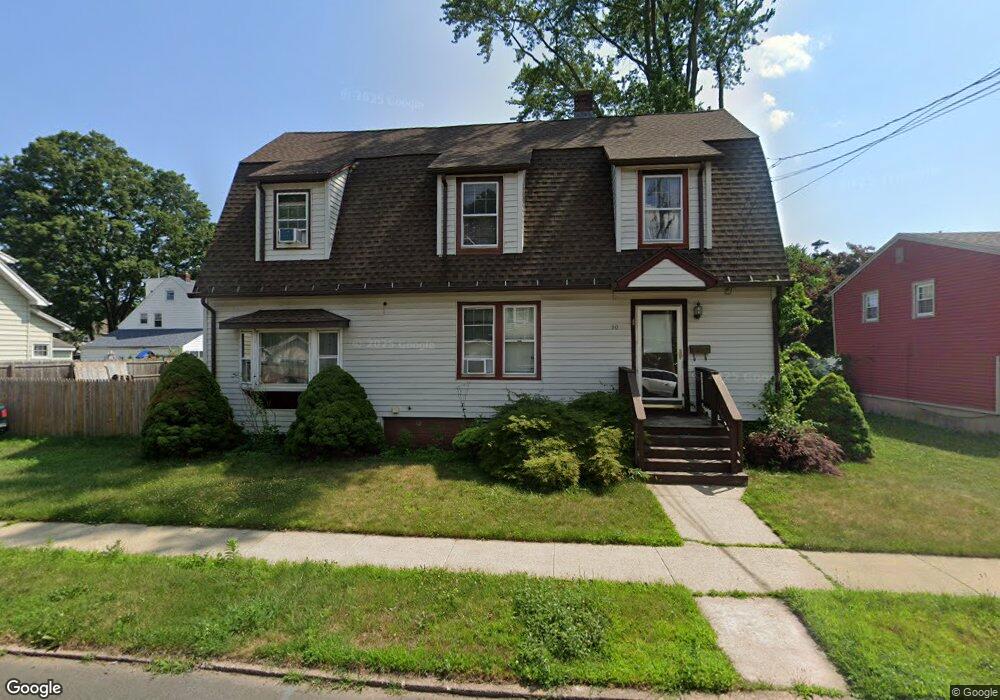
30 Sidney St East Haven, CT 06512
Estimated Value: $378,292 - $530,000
4
Beds
2
Baths
2,244
Sq Ft
$197/Sq Ft
Est. Value
About This Home
This home is located at 30 Sidney St, East Haven, CT 06512 and is currently estimated at $443,073, approximately $197 per square foot. 30 Sidney St is a home located in New Haven County with nearby schools including East Haven High School, Cold Spring School, and Pathway School.
Ownership History
Date
Name
Owned For
Owner Type
Purchase Details
Closed on
Jul 19, 2018
Sold by
Augur William
Bought by
Augur Brian
Current Estimated Value
Purchase Details
Closed on
Apr 9, 2018
Sold by
Augur Yvonne and Augur Christopher
Bought by
Augur William
Purchase Details
Closed on
Sep 3, 2015
Sold by
Augur William
Bought by
Augur Yvonne and Augur Christopher
Purchase Details
Closed on
Oct 1, 1996
Sold by
New Haven Savings Bank
Bought by
Augur Brian
Home Financials for this Owner
Home Financials are based on the most recent Mortgage that was taken out on this home.
Original Mortgage
$106,500
Interest Rate
7.83%
Mortgage Type
Unknown
Purchase Details
Closed on
Mar 28, 1989
Sold by
Leone Edward
Bought by
Cosacchi Brian J
Home Financials for this Owner
Home Financials are based on the most recent Mortgage that was taken out on this home.
Original Mortgage
$131,200
Interest Rate
10.49%
Create a Home Valuation Report for This Property
The Home Valuation Report is an in-depth analysis detailing your home's value as well as a comparison with similar homes in the area
Home Values in the Area
Average Home Value in this Area
Purchase History
| Date | Buyer | Sale Price | Title Company |
|---|---|---|---|
| Augur Brian | -- | -- | |
| Augur William | -- | -- | |
| Augur Yvonne | -- | -- | |
| Augur Brian | $107,000 | -- | |
| Cosacchi Brian J | $175,000 | -- |
Source: Public Records
Mortgage History
| Date | Status | Borrower | Loan Amount |
|---|---|---|---|
| Previous Owner | Cosacchi Brian J | $175,000 | |
| Previous Owner | Cosacchi Brian J | $106,500 | |
| Previous Owner | Cosacchi Brian J | $131,200 |
Source: Public Records
Tax History Compared to Growth
Tax History
| Year | Tax Paid | Tax Assessment Tax Assessment Total Assessment is a certain percentage of the fair market value that is determined by local assessors to be the total taxable value of land and additions on the property. | Land | Improvement |
|---|---|---|---|---|
| 2025 | $5,819 | $174,020 | $47,670 | $126,350 |
| 2024 | $5,819 | $174,020 | $47,670 | $126,350 |
| 2023 | $5,429 | $174,020 | $47,670 | $126,350 |
| 2022 | $5,429 | $174,020 | $47,670 | $126,350 |
| 2021 | $5,226 | $152,580 | $45,600 | $106,980 |
| 2020 | $5,226 | $152,580 | $45,600 | $106,980 |
| 2019 | $4,947 | $152,580 | $45,600 | $106,980 |
| 2018 | $4,951 | $152,580 | $45,600 | $106,980 |
| 2017 | $4,814 | $152,580 | $45,600 | $106,980 |
| 2016 | $5,139 | $162,900 | $45,590 | $117,310 |
| 2015 | $5,139 | $162,900 | $45,590 | $117,310 |
| 2014 | $5,221 | $162,900 | $45,590 | $117,310 |
Source: Public Records
Map
Nearby Homes