
Seller's Agent in 2025
Jane Collinson
Gibson Sotheby's International Realty
(617) 543-9690
4 in this area
48 Total Sales

Estimated Value: $2,306,368 - $2,437,000
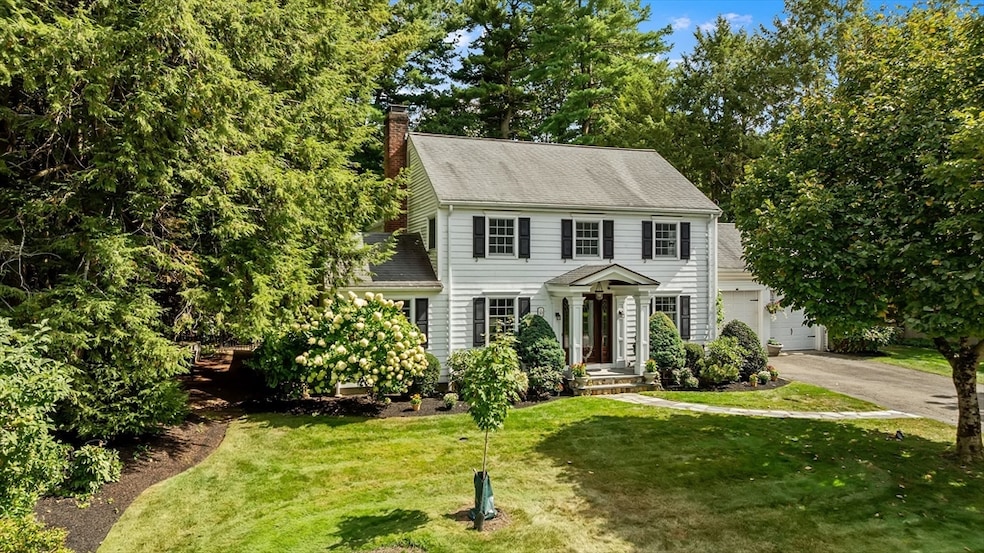
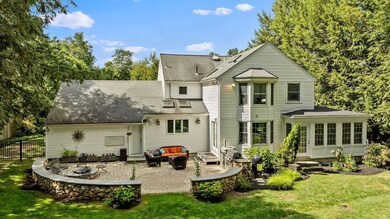
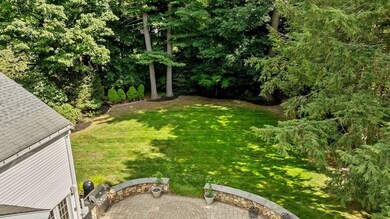
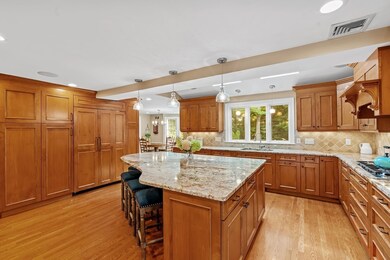
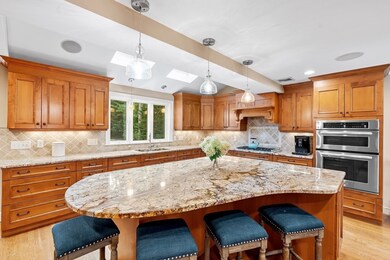
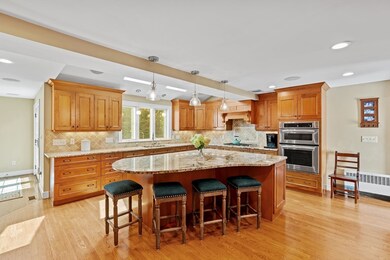
Beautifully sited in one of Wellesley's most desirable neighborhoods, this classic Colonial offers easy access to the Brook Path, commuter rail to Boston, top-rated schools, playgrounds, and Wellesley's vibrant downtown. The expansive kitchen features a generous center island & sunny breakfast area with French doors leading to the stunning patio with built-in grill, frig & fire pit. The dining & family rooms flow seamlessly into the kitchen—ideal for everyday living and entertaining. Step into the inviting three-season porch, which opens to a beautifully landscaped, private backyard haven. A charming see-through fireplace adds warmth & character between the living and family rooms. Upstairs, you’ll find 4 bedrooms & 2 baths including a primary bedroom with cathedral ceiling and en suite bath. The finished lower level offers versatile bonus space for game room, home gym, crafts, hobbies, music studio, media room. Don't miss this exceptional home—this is the one you've been waiting for
Last Agent to Sell the Property
Gibson Sotheby's International Realty Listed on: 09/10/2025
| Date | Buyer | Sale Price | Title Company |
|---|---|---|---|
| Lewis Samson | $2,405,000 | -- | |
| Lazaro Emmanuel D | $1,202,000 | -- | |
| Lazaro Emmanuel D | $1,202,000 | -- |
| Date | Status | Borrower | Loan Amount |
|---|---|---|---|
| Previous Owner | Lazaro Emmanuel D | $60,000 | |
| Previous Owner | Lazaro Emmanuel D | $900,000 |
| Date | Event | Price | List to Sale | Price per Sq Ft |
|---|---|---|---|---|
| 11/03/2025 11/03/25 | Sold | $2,405,000 | +0.4% | $765 / Sq Ft |
| 09/20/2025 09/20/25 | Pending | -- | -- | -- |
| 09/10/2025 09/10/25 | For Sale | $2,395,000 | -- | $762 / Sq Ft |
| Year | Tax Paid | Tax Assessment Tax Assessment Total Assessment is a certain percentage of the fair market value that is determined by local assessors to be the total taxable value of land and additions on the property. | Land | Improvement |
|---|---|---|---|---|
| 2025 | $17,640 | $1,716,000 | $1,266,000 | $450,000 |
| 2024 | $17,135 | $1,646,000 | $1,209,000 | $437,000 |
| 2023 | $17,278 | $1,509,000 | $1,105,000 | $404,000 |
| 2022 | $15,453 | $1,323,000 | $914,000 | $409,000 |
| 2021 | $15,545 | $1,323,000 | $914,000 | $409,000 |
| 2020 | $15,294 | $1,323,000 | $914,000 | $409,000 |
| 2019 | $15,307 | $1,323,000 | $914,000 | $409,000 |
| 2018 | $13,539 | $1,133,000 | $756,000 | $377,000 |
| 2017 | $13,370 | $1,134,000 | $757,000 | $377,000 |
| 2016 | $13,108 | $1,108,000 | $744,000 | $364,000 |
| 2015 | $12,832 | $1,110,000 | $744,000 | $366,000 |
Seller's Agent in 2025
Jane Collinson
Gibson Sotheby's International Realty
(617) 543-9690
4 in this area
48 Total Sales
G
Buyer's Agent in 2025
Gina Morda
Corcoran Property Advisors
(617) 818-5922
1 in this area
11 Total Sales
Source: MLS Property Information Network (MLS PIN)
MLS Number: 73429178
APN: WELL-000100-000059
Disclaimer: Certain information contained herein is derived from information provided by parties other than Homes.com. All information provided is deemed reliable, but is not guaranteed to be accurate and should be independently verified.
![]() The property listing data and information, or the Images, set forth herein were provided to MLS Property Information Network, Inc. from third party sources, including sellers, lessors and public records, and were compiled by MLS Property Information Network, Inc. The property listing data and information, and the Images, are for the personal, non-commercial use of consumers having a good faith interest in purchasing or leasing listed properties of the type displayed to them and may not be used for any purpose other than to identify prospective properties which such consumers may have a good faith interest in purchasing or leasing. MLS Property Information Network, Inc. and its subscribers disclaim any and all representations and warranties as to the accuracy of the property listing data and information, or as to the accuracy of any of the Images, set forth herein.
The property listing data and information, or the Images, set forth herein were provided to MLS Property Information Network, Inc. from third party sources, including sellers, lessors and public records, and were compiled by MLS Property Information Network, Inc. The property listing data and information, and the Images, are for the personal, non-commercial use of consumers having a good faith interest in purchasing or leasing listed properties of the type displayed to them and may not be used for any purpose other than to identify prospective properties which such consumers may have a good faith interest in purchasing or leasing. MLS Property Information Network, Inc. and its subscribers disclaim any and all representations and warranties as to the accuracy of the property listing data and information, or as to the accuracy of any of the Images, set forth herein.
Ask me questions while you tour the home.