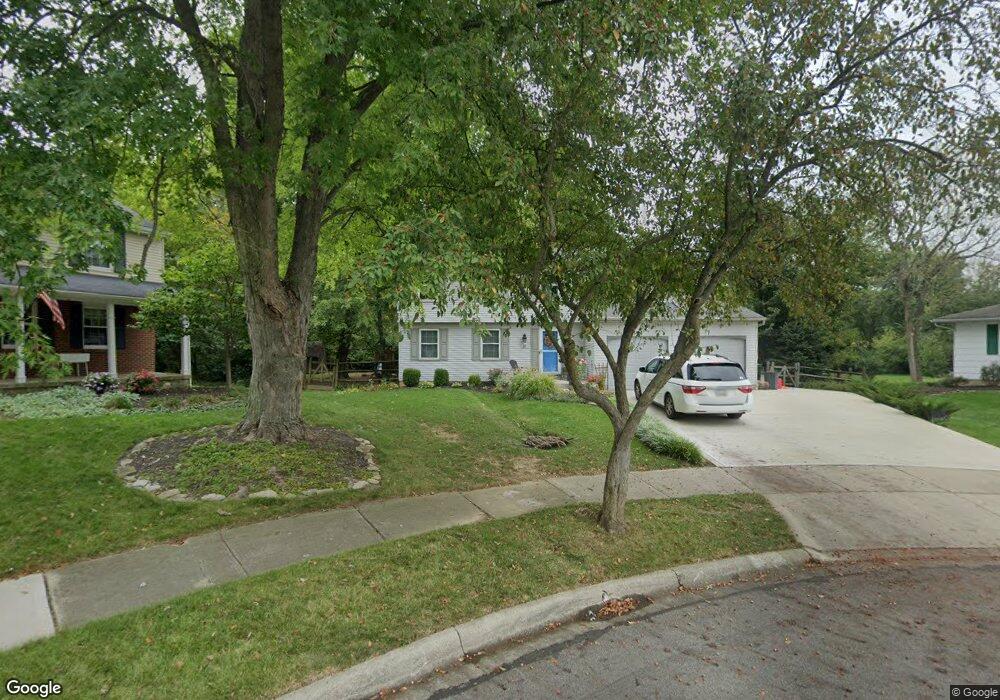
30 Spring Hollow Ct Westerville, OH 43081
Estimated Value: $403,000 - $440,000
4
Beds
3
Baths
1,932
Sq Ft
$219/Sq Ft
Est. Value
About This Home
This home is located at 30 Spring Hollow Ct, Westerville, OH 43081 and is currently estimated at $422,380, approximately $218 per square foot. 30 Spring Hollow Ct is a home located in Franklin County with nearby schools including Annehurst Elementary School, Heritage Middle School, and Westerville South High School.
Ownership History
Date
Name
Owned For
Owner Type
Purchase Details
Closed on
Aug 18, 2017
Sold by
Gantzer Ty C and Peace Tracy A
Bought by
Coplen Nicholas L and Coplen Kelsey L
Current Estimated Value
Home Financials for this Owner
Home Financials are based on the most recent Mortgage that was taken out on this home.
Original Mortgage
$193,800
Outstanding Balance
$161,711
Interest Rate
3.96%
Mortgage Type
Future Advance Clause Open End Mortgage
Estimated Equity
$260,669
Purchase Details
Closed on
Jun 28, 2001
Sold by
Blum Philip C and Blum Lori S
Bought by
Gantzer Ty C and Peace Tracy A
Home Financials for this Owner
Home Financials are based on the most recent Mortgage that was taken out on this home.
Original Mortgage
$137,200
Interest Rate
7.27%
Mortgage Type
Purchase Money Mortgage
Purchase Details
Closed on
Mar 23, 1994
Bought by
Blum Philip C and Blum Lori S
Purchase Details
Closed on
May 4, 1993
Purchase Details
Closed on
Dec 13, 1991
Create a Home Valuation Report for This Property
The Home Valuation Report is an in-depth analysis detailing your home's value as well as a comparison with similar homes in the area
Home Values in the Area
Average Home Value in this Area
Purchase History
| Date | Buyer | Sale Price | Title Company |
|---|---|---|---|
| Coplen Nicholas L | $228,000 | Win Title Agency Llc | |
| Gantzer Ty C | $171,500 | -- | |
| Blum Philip C | $125,900 | -- | |
| -- | -- | -- | |
| -- | -- | -- |
Source: Public Records
Mortgage History
| Date | Status | Borrower | Loan Amount |
|---|---|---|---|
| Open | Coplen Nicholas L | $193,800 | |
| Closed | Gantzer Ty C | $137,200 |
Source: Public Records
Tax History Compared to Growth
Tax History
| Year | Tax Paid | Tax Assessment Tax Assessment Total Assessment is a certain percentage of the fair market value that is determined by local assessors to be the total taxable value of land and additions on the property. | Land | Improvement |
|---|---|---|---|---|
| 2024 | $6,704 | $117,960 | $32,730 | $85,230 |
| 2023 | $6,562 | $117,960 | $32,730 | $85,230 |
| 2022 | $5,587 | $76,690 | $15,400 | $61,290 |
| 2021 | $5,634 | $76,690 | $15,400 | $61,290 |
| 2020 | $5,618 | $76,690 | $15,400 | $61,290 |
| 2019 | $5,166 | $66,570 | $15,400 | $51,170 |
| 2018 | $4,889 | $66,570 | $15,400 | $51,170 |
| 2017 | $5,081 | $66,570 | $15,400 | $51,170 |
| 2016 | $4,866 | $58,040 | $20,060 | $37,980 |
| 2015 | $4,713 | $58,040 | $20,060 | $37,980 |
| 2014 | $4,716 | $58,040 | $20,060 | $37,980 |
| 2013 | $2,355 | $58,030 | $20,055 | $37,975 |
Source: Public Records
Map
Nearby Homes
- 258 Bellefield Ave
- 1095 Belle Meade Place
- 106 Ormsbee Ave
- 7691 Key Deer Dr
- 7685 Key Deer Dr Unit 7685
- 1585 Fawn Ct
- 828 Memories Ln
- 774 W Main St
- 953 Arcadia Blvd
- 1024 Arcadia Blvd
- 671 College Crest Rd
- 658 River Trace
- 8278 Mira St Unit 154
- 8282 Mira St Unit 153
- 640 Glacier Pass
- 7852 Heathcock Ct
- 1296 Blacksmith Dr
- 101 W Ticonderoga Dr Unit B
- 1335 Clement Dr
- 134 W Ticonderoga Dr Unit D
- 27 Spring Hollow Ct
- 36 Spring Hollow Ct
- 47 Ormsbee Ave
- 53 Ormsbee Ave
- 43 Ormsbee Ave
- 30 Spring Hollow Ln
- 20 Spring Hollow Ln
- 63 Ormsbee Ave
- 44 Spring Hollow Ln
- 37 Ormsbee Ave
- 36 Spring Hollow Ln
- 71 Ormsbee Ave
- 1072 W Main St
- 1064 W Main St
- 1078 W Main St
- 29 Ormsbee Ave
- 50 Spring Hollow Ln
- 16 Spring Hollow Ln
- 81 Ormsbee Ave
- 1056 W Main St