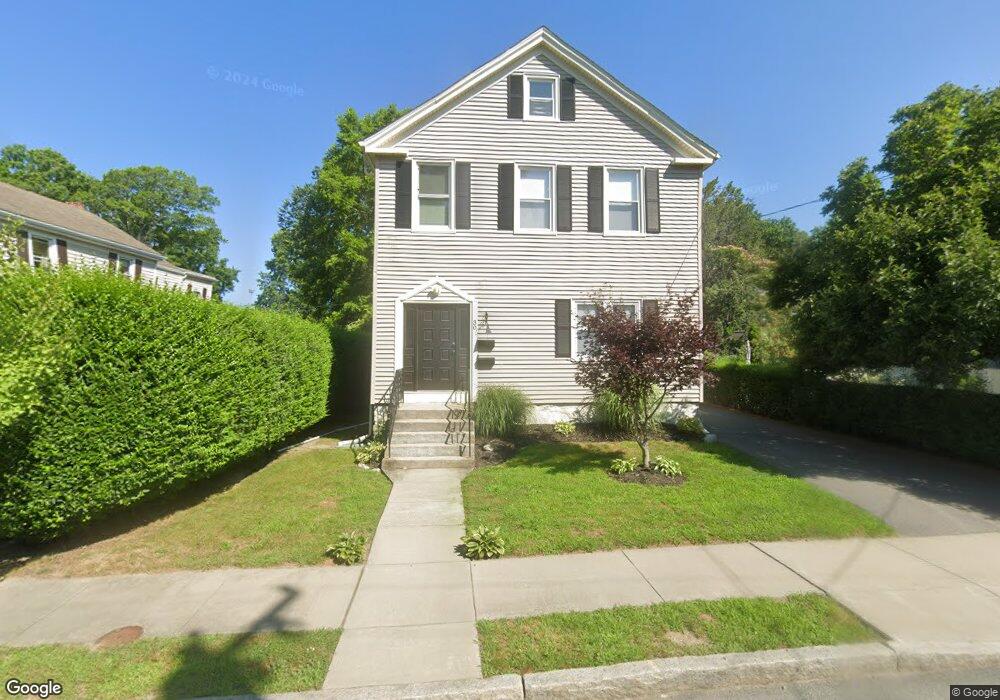
30 Spring St Fairhaven, MA 02719
Estimated Value: $477,000 - $501,000
4
Beds
2
Baths
2,000
Sq Ft
$247/Sq Ft
Est. Value
About This Home
This home is located at 30 Spring St, Fairhaven, MA 02719 and is currently estimated at $493,294, approximately $246 per square foot. 30 Spring St is a home located in Bristol County with nearby schools including Fairhaven High School, City On A Hill Charter Public School New Bedford, and St. Joseph School.
Ownership History
Date
Name
Owned For
Owner Type
Purchase Details
Closed on
Jan 11, 2018
Sold by
Cruz Manuel A
Bought by
Cruz Doreen M
Current Estimated Value
Purchase Details
Closed on
Apr 11, 2001
Sold by
Moniz Tammy L
Bought by
Cruz Manuel A and Cruz Doreen M
Home Financials for this Owner
Home Financials are based on the most recent Mortgage that was taken out on this home.
Original Mortgage
$62,625
Interest Rate
6.97%
Mortgage Type
Purchase Money Mortgage
Create a Home Valuation Report for This Property
The Home Valuation Report is an in-depth analysis detailing your home's value as well as a comparison with similar homes in the area
Home Values in the Area
Average Home Value in this Area
Purchase History
| Date | Buyer | Sale Price | Title Company |
|---|---|---|---|
| Cruz Doreen M | -- | -- | |
| Cruz Manuel A | $83,500 | -- |
Source: Public Records
Mortgage History
| Date | Status | Borrower | Loan Amount |
|---|---|---|---|
| Previous Owner | Cruz Manuel A | $80,000 | |
| Previous Owner | Cruz Manuel A | $62,625 | |
| Previous Owner | Cruz Manuel A | $55,350 |
Source: Public Records
Tax History
| Year | Tax Paid | Tax Assessment Tax Assessment Total Assessment is a certain percentage of the fair market value that is determined by local assessors to be the total taxable value of land and additions on the property. | Land | Improvement |
|---|---|---|---|---|
| 2025 | $34 | $365,000 | $173,700 | $191,300 |
| 2024 | $3,311 | $358,700 | $173,700 | $185,000 |
| 2023 | $3,213 | $322,900 | $152,200 | $170,700 |
| 2022 | $3,075 | $300,900 | $141,400 | $159,500 |
| 2021 | $2,985 | $264,400 | $127,900 | $136,500 |
| 2020 | $2,924 | $264,400 | $127,900 | $136,500 |
| 2019 | $2,884 | $247,100 | $106,100 | $141,000 |
| 2018 | $2,049 | $232,000 | $101,000 | $131,000 |
| 2017 | $2,637 | $219,000 | $101,000 | $118,000 |
| 2016 | $2,540 | $208,500 | $101,000 | $107,500 |
| 2015 | $2,494 | $205,300 | $101,000 | $104,300 |
Source: Public Records
Map
Nearby Homes
Your Personal Tour Guide
Ask me questions while you tour the home.