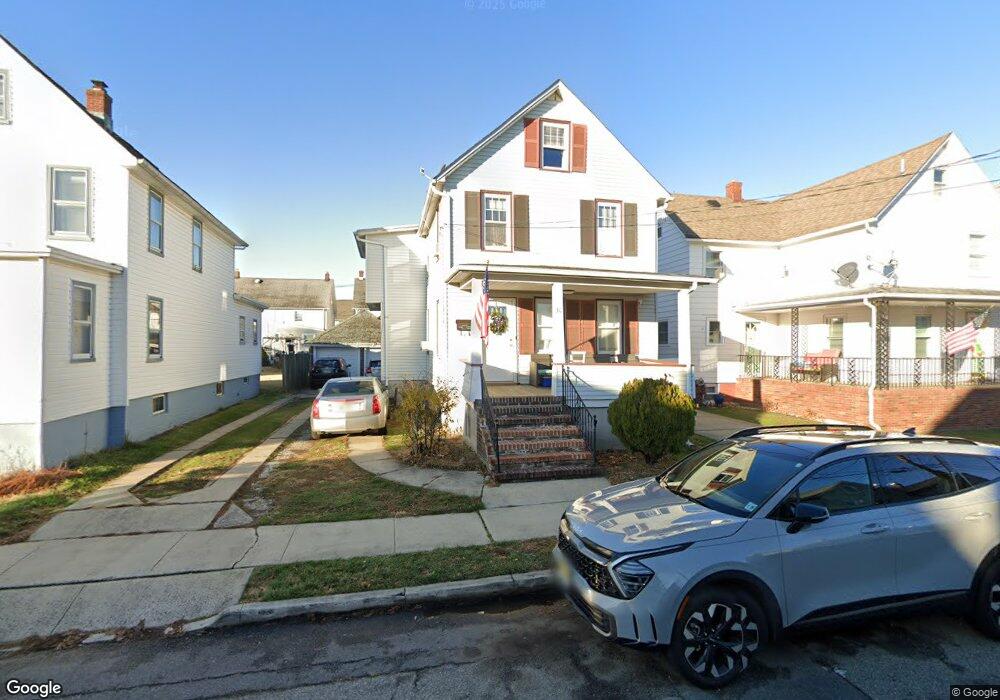
30 Stanton St South River, NJ 08882
Estimated Value: $417,006 - $470,000
--
Bed
--
Bath
1,664
Sq Ft
$269/Sq Ft
Est. Value
About This Home
This home is located at 30 Stanton St, South River, NJ 08882 and is currently estimated at $447,252, approximately $268 per square foot. 30 Stanton St is a home located in Middlesex County with nearby schools including South River Primary School, South River Elementary School, and South River Middle School.
Ownership History
Date
Name
Owned For
Owner Type
Purchase Details
Closed on
Feb 11, 2000
Sold by
Gois Florbella
Bought by
Figueroa Miguel and Figueroa Hilda
Current Estimated Value
Home Financials for this Owner
Home Financials are based on the most recent Mortgage that was taken out on this home.
Original Mortgage
$133,000
Outstanding Balance
$43,806
Interest Rate
8.11%
Estimated Equity
$403,446
Purchase Details
Closed on
Nov 25, 1997
Sold by
Errico Mary Kalinka
Bought by
Gois Florbella
Home Financials for this Owner
Home Financials are based on the most recent Mortgage that was taken out on this home.
Original Mortgage
$98,000
Interest Rate
7.28%
Create a Home Valuation Report for This Property
The Home Valuation Report is an in-depth analysis detailing your home's value as well as a comparison with similar homes in the area
Home Values in the Area
Average Home Value in this Area
Purchase History
| Date | Buyer | Sale Price | Title Company |
|---|---|---|---|
| Figueroa Miguel | $140,000 | -- | |
| Gois Florbella | $108,500 | -- |
Source: Public Records
Mortgage History
| Date | Status | Borrower | Loan Amount |
|---|---|---|---|
| Open | Figueroa Miguel | $133,000 | |
| Previous Owner | Gois Florbella | $98,000 |
Source: Public Records
Tax History Compared to Growth
Tax History
| Year | Tax Paid | Tax Assessment Tax Assessment Total Assessment is a certain percentage of the fair market value that is determined by local assessors to be the total taxable value of land and additions on the property. | Land | Improvement |
|---|---|---|---|---|
| 2025 | $6,396 | $251,100 | $130,000 | $121,100 |
| 2024 | $6,205 | $251,100 | $130,000 | $121,100 |
| 2023 | $6,205 | $251,100 | $130,000 | $121,100 |
| 2022 | $6,097 | $251,100 | $130,000 | $121,100 |
| 2021 | $3,956 | $251,100 | $130,000 | $121,100 |
| 2020 | $5,743 | $251,100 | $130,000 | $121,100 |
| 2019 | $6,170 | $74,900 | $17,200 | $57,700 |
| 2018 | $6,021 | $74,900 | $17,200 | $57,700 |
| 2017 | $5,801 | $74,900 | $17,200 | $57,700 |
| 2016 | $5,582 | $74,900 | $17,200 | $57,700 |
| 2015 | $5,456 | $74,900 | $17,200 | $57,700 |
| 2014 | $5,331 | $74,900 | $17,200 | $57,700 |
Source: Public Records
Map
Nearby Homes