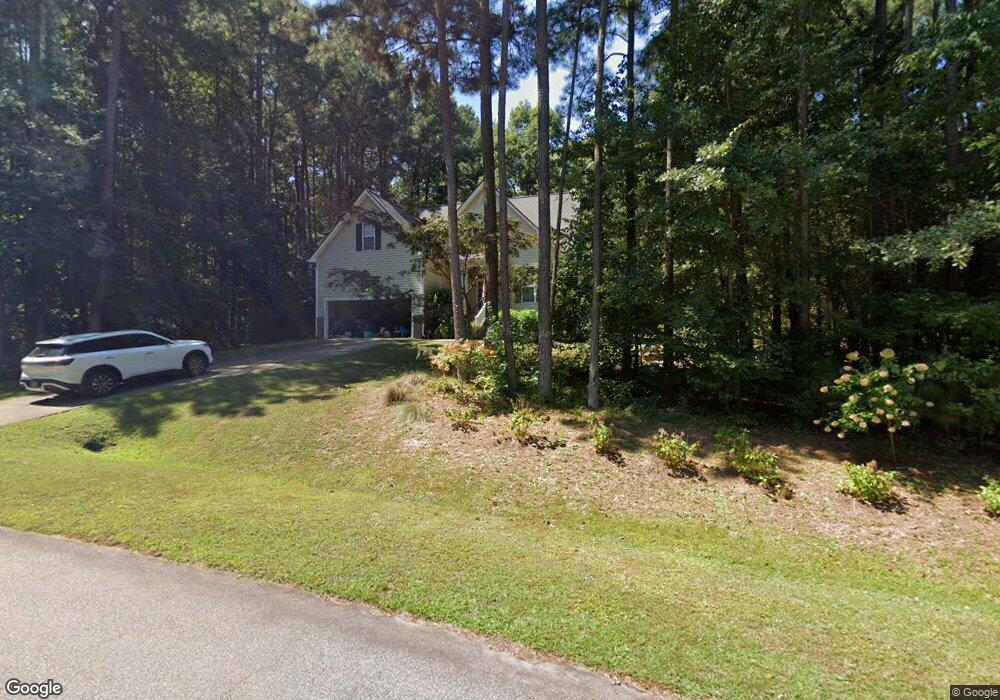
30 Sweetgrass Ln Youngsville, NC 27596
Estimated Value: $422,000 - $465,000
3
Beds
3
Baths
2,300
Sq Ft
$192/Sq Ft
Est. Value
About This Home
This home is located at 30 Sweetgrass Ln, Youngsville, NC 27596 and is currently estimated at $441,461, approximately $191 per square foot. 30 Sweetgrass Ln is a home located in Franklin County with nearby schools including Royal Elementary School, Bunn Middle School, and Bunn High School.
Ownership History
Date
Name
Owned For
Owner Type
Purchase Details
Closed on
Nov 20, 2012
Sold by
Smith Kresta L and Smith Aaron R
Bought by
Smith Aaron R and Smith Kresta L
Current Estimated Value
Home Financials for this Owner
Home Financials are based on the most recent Mortgage that was taken out on this home.
Original Mortgage
$204,320
Outstanding Balance
$139,741
Interest Rate
3.25%
Mortgage Type
FHA
Estimated Equity
$301,720
Purchase Details
Closed on
May 4, 2009
Sold by
Maestro Homes Incorporated
Bought by
Kessler Kresta L
Home Financials for this Owner
Home Financials are based on the most recent Mortgage that was taken out on this home.
Original Mortgage
$217,490
Interest Rate
4.86%
Mortgage Type
FHA
Purchase Details
Closed on
Aug 10, 2007
Sold by
Zula Belle Investments Co Llc
Bought by
Maestro Homes Inc
Home Financials for this Owner
Home Financials are based on the most recent Mortgage that was taken out on this home.
Original Mortgage
$196,000
Interest Rate
6.65%
Mortgage Type
Construction
Create a Home Valuation Report for This Property
The Home Valuation Report is an in-depth analysis detailing your home's value as well as a comparison with similar homes in the area
Home Values in the Area
Average Home Value in this Area
Purchase History
| Date | Buyer | Sale Price | Title Company |
|---|---|---|---|
| Smith Aaron R | -- | None Available | |
| Kessler Kresta L | $225,000 | None Available | |
| Maestro Homes Inc | $40,000 | None Available |
Source: Public Records
Mortgage History
| Date | Status | Borrower | Loan Amount |
|---|---|---|---|
| Open | Smith Aaron R | $204,320 | |
| Closed | Kessler Kresta L | $217,490 | |
| Previous Owner | Maestro Homes Inc | $196,000 |
Source: Public Records
Tax History Compared to Growth
Tax History
| Year | Tax Paid | Tax Assessment Tax Assessment Total Assessment is a certain percentage of the fair market value that is determined by local assessors to be the total taxable value of land and additions on the property. | Land | Improvement |
|---|---|---|---|---|
| 2025 | $2,344 | $391,910 | $134,400 | $257,510 |
| 2024 | $2,305 | $391,910 | $134,400 | $257,510 |
| 2023 | $2,239 | $247,610 | $36,750 | $210,860 |
| 2022 | $2,229 | $247,610 | $36,750 | $210,860 |
| 2021 | $2,254 | $247,610 | $36,750 | $210,860 |
| 2020 | $2,268 | $247,610 | $36,750 | $210,860 |
| 2019 | $2,236 | $247,610 | $36,750 | $210,860 |
| 2018 | $2,235 | $247,610 | $36,750 | $210,860 |
| 2017 | $1,856 | $185,440 | $35,000 | $150,440 |
| 2016 | $1,920 | $185,440 | $35,000 | $150,440 |
| 2015 | $1,920 | $185,440 | $35,000 | $150,440 |
| 2014 | $1,798 | $185,440 | $35,000 | $150,440 |
Source: Public Records
Map
Nearby Homes
- 20 Richmond Place
- 10 Shorrey Place
- 90 Eagle Chase Dr
- 150 Williamston Ridge Dr
- 95 Shorrey Place
- 65 Linnett Ct
- 20 Willows Den Ct
- 136 Dixie Ln
- 138 Bridle Trail
- 3555 Nc 98 Hwy W
- 463 Robbins Rd
- 150 Babbling Creek Dr
- 50 Babbling Creek Dr
- 85 Weathered Oak Way
- 85 Old Garden Ln
- 40 Yellowstone Ct
- 40 Muirfield Dr
- 5916 2 Pines Trail
- 85 Arbor Dr
- 25 Arbor Dr
- 20 Sweetgrass Ln
- 25 Sweetgrass Ln
- 10 Sweetgrass Ln
- 15 Sweetgrass Ln
- 0 Sweet Grass Ln Unit 1663761
- 0 Sweet Grass Ln Unit 181 TR1663761
- 63 Dents Dr
- 63 Dents Dr
- 537 Frazier Rd
- 4 Dents Ln
- 465 Spencers Gate Dr
- 35 Addison Ct
- 40 Raybon Place
- 505 Frazier Rd
- 25 Addison Ct Unit L 83
- 25 Addison Ct
- 82 Addison Ct
- 84 Addison Ct
- 83 Addison Ct
- Lot 82 Addison Ct