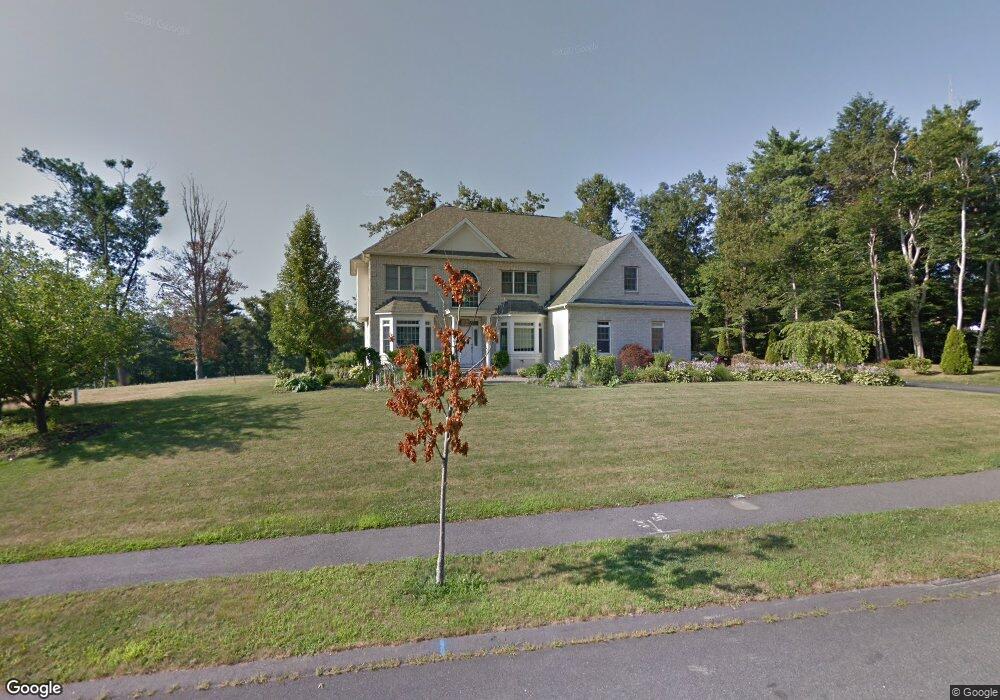
30 Sylvan Ln Boylston, MA 01505
Estimated Value: $1,172,000 - $1,404,000
5
Beds
5
Baths
3,900
Sq Ft
$327/Sq Ft
Est. Value
About This Home
This home is located at 30 Sylvan Ln, Boylston, MA 01505 and is currently estimated at $1,275,059, approximately $326 per square foot. 30 Sylvan Ln is a home located in Worcester County with nearby schools including Tahanto Regional High School.
Ownership History
Date
Name
Owned For
Owner Type
Purchase Details
Closed on
Dec 24, 2012
Sold by
Baara Munther
Bought by
Baara Munther and Jahed Hala
Current Estimated Value
Home Financials for this Owner
Home Financials are based on the most recent Mortgage that was taken out on this home.
Original Mortgage
$300,000
Outstanding Balance
$30,995
Interest Rate
3.43%
Mortgage Type
New Conventional
Estimated Equity
$1,244,064
Purchase Details
Closed on
Sep 15, 2010
Sold by
Azizian Shavarsh
Bought by
Baara Munther H
Home Financials for this Owner
Home Financials are based on the most recent Mortgage that was taken out on this home.
Original Mortgage
$350,000
Interest Rate
4.51%
Mortgage Type
Purchase Money Mortgage
Purchase Details
Closed on
Mar 31, 2004
Sold by
C&M Custom Homes Inc
Bought by
Azizian Lusia and Azizian Shavarsh
Home Financials for this Owner
Home Financials are based on the most recent Mortgage that was taken out on this home.
Original Mortgage
$380,000
Interest Rate
5.56%
Mortgage Type
Purchase Money Mortgage
Create a Home Valuation Report for This Property
The Home Valuation Report is an in-depth analysis detailing your home's value as well as a comparison with similar homes in the area
Home Values in the Area
Average Home Value in this Area
Purchase History
| Date | Buyer | Sale Price | Title Company |
|---|---|---|---|
| Baara Munther | -- | -- | |
| Baara Munther H | $541,000 | -- | |
| Azizian Lusia | $755,000 | -- |
Source: Public Records
Mortgage History
| Date | Status | Borrower | Loan Amount |
|---|---|---|---|
| Open | Baara Munther | $300,000 | |
| Previous Owner | Baara Munther H | $350,000 | |
| Previous Owner | Azizian Lusia | $380,000 |
Source: Public Records
Tax History Compared to Growth
Tax History
| Year | Tax Paid | Tax Assessment Tax Assessment Total Assessment is a certain percentage of the fair market value that is determined by local assessors to be the total taxable value of land and additions on the property. | Land | Improvement |
|---|---|---|---|---|
| 2025 | $15,822 | $1,144,000 | $223,100 | $920,900 |
| 2024 | $14,092 | $1,020,400 | $223,100 | $797,300 |
| 2023 | $12,388 | $860,300 | $195,500 | $664,800 |
| 2022 | $12,791 | $807,500 | $195,500 | $612,000 |
| 2021 | $12,985 | $764,700 | $195,500 | $569,200 |
| 2020 | $5,896 | $760,100 | $195,100 | $565,000 |
| 2019 | $11,698 | $729,300 | $193,500 | $535,800 |
| 2018 | $11,780 | $704,100 | $193,500 | $510,600 |
| 2017 | $11,350 | $704,100 | $193,500 | $510,600 |
| 2016 | $11,043 | $674,600 | $173,500 | $501,100 |
| 2015 | $11,745 | $674,600 | $173,500 | $501,100 |
| 2014 | $11,091 | $637,800 | $160,300 | $477,500 |
Source: Public Records
Map
Nearby Homes
- 48 Perry Rd
- 18 Bay Path Dr
- 70 Colonial Dr
- 34 Joseph Rd
- 20 Rawson Hill Dr
- 7-11 Reservoir St
- 5 Sewall St Unit 259
- 11 Cranbrook Rd
- 25 Castle Rd
- 35 Woodstone Rd
- 28 Camelot Dr
- 33 Woodstone Rd
- 21 School St
- 20 Olde Colony Dr
- 9 Morningside Dr
- 2 Harmony Ln Unit 1
- 7 Oakwood Cir Unit 15
- 1 Harmony Ln Unit 4
- 8 Burkhardt Cir Unit 8
- 4 Harmony Ln Unit 2