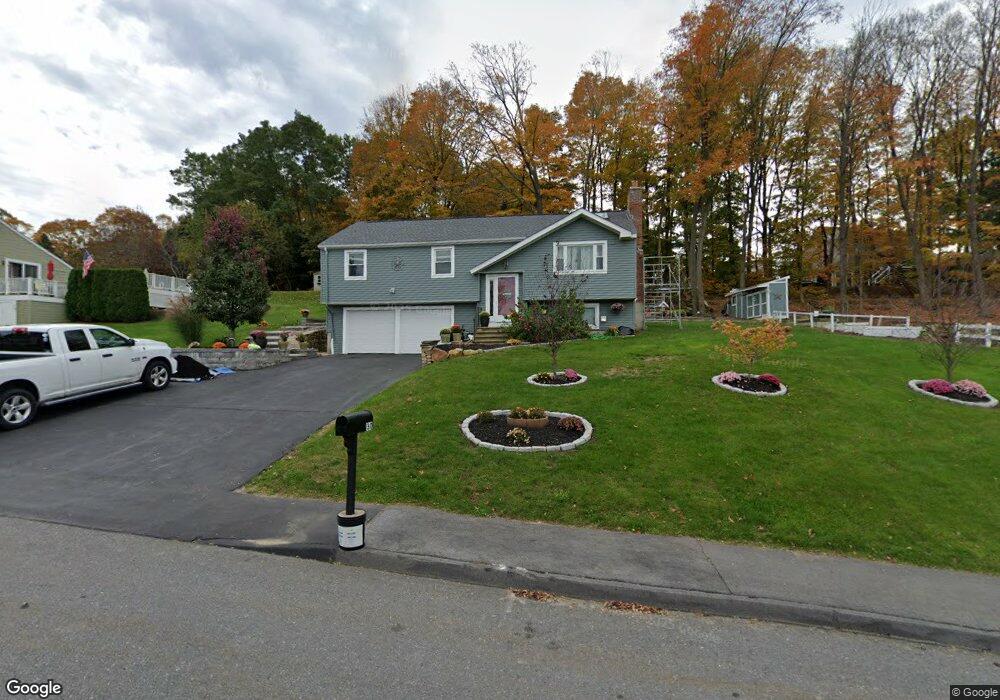
30 Tassi Dr Marlborough, MA 01752
French Hill NeighborhoodEstimated Value: $560,000 - $622,473
3
Beds
2
Baths
1,219
Sq Ft
$489/Sq Ft
Est. Value
About This Home
This home is located at 30 Tassi Dr, Marlborough, MA 01752 and is currently estimated at $596,118, approximately $489 per square foot. 30 Tassi Dr is a home located in Middlesex County with nearby schools including Marlborough High School, New Covenant Christian School, and Glenhaven Academy - JRI School.
Ownership History
Date
Name
Owned For
Owner Type
Purchase Details
Closed on
Sep 22, 2016
Sold by
Deutsche Bk Natl T Co
Bought by
Dealmeida Izabel
Current Estimated Value
Home Financials for this Owner
Home Financials are based on the most recent Mortgage that was taken out on this home.
Original Mortgage
$239,335
Outstanding Balance
$191,294
Interest Rate
3.45%
Mortgage Type
New Conventional
Estimated Equity
$404,824
Purchase Details
Closed on
Jul 19, 1991
Sold by
Cote Bertrand R and Cote Barbara A
Bought by
Canzater Alonzo and Canzater Regina
Create a Home Valuation Report for This Property
The Home Valuation Report is an in-depth analysis detailing your home's value as well as a comparison with similar homes in the area
Home Values in the Area
Average Home Value in this Area
Purchase History
| Date | Buyer | Sale Price | Title Company |
|---|---|---|---|
| Dealmeida Izabel | $299,169 | -- | |
| Canzater Alonzo | $155,500 | -- |
Source: Public Records
Mortgage History
| Date | Status | Borrower | Loan Amount |
|---|---|---|---|
| Open | Dealmeida Izabel | $239,335 | |
| Previous Owner | Canzater Alonzo | $250,000 | |
| Previous Owner | Canzater Alonzo | $50,000 | |
| Previous Owner | Canzater Alonzo | $73,000 |
Source: Public Records
Tax History Compared to Growth
Tax History
| Year | Tax Paid | Tax Assessment Tax Assessment Total Assessment is a certain percentage of the fair market value that is determined by local assessors to be the total taxable value of land and additions on the property. | Land | Improvement |
|---|---|---|---|---|
| 2025 | $5,511 | $558,900 | $261,600 | $297,300 |
| 2024 | $5,323 | $519,800 | $237,800 | $282,000 |
| 2023 | $5,612 | $486,300 | $194,500 | $291,800 |
| 2022 | $5,493 | $418,700 | $185,100 | $233,600 |
| 2021 | $5,303 | $384,300 | $157,200 | $227,100 |
| 2020 | $5,129 | $361,700 | $144,300 | $217,400 |
| 2019 | $5,003 | $355,600 | $141,400 | $214,200 |
| 2018 | $4,800 | $328,100 | $121,600 | $206,500 |
| 2017 | $5,026 | $328,100 | $118,800 | $209,300 |
| 2016 | $4,883 | $318,300 | $118,800 | $199,500 |
| 2015 | $4,504 | $285,800 | $128,300 | $157,500 |
Source: Public Records
Map
Nearby Homes