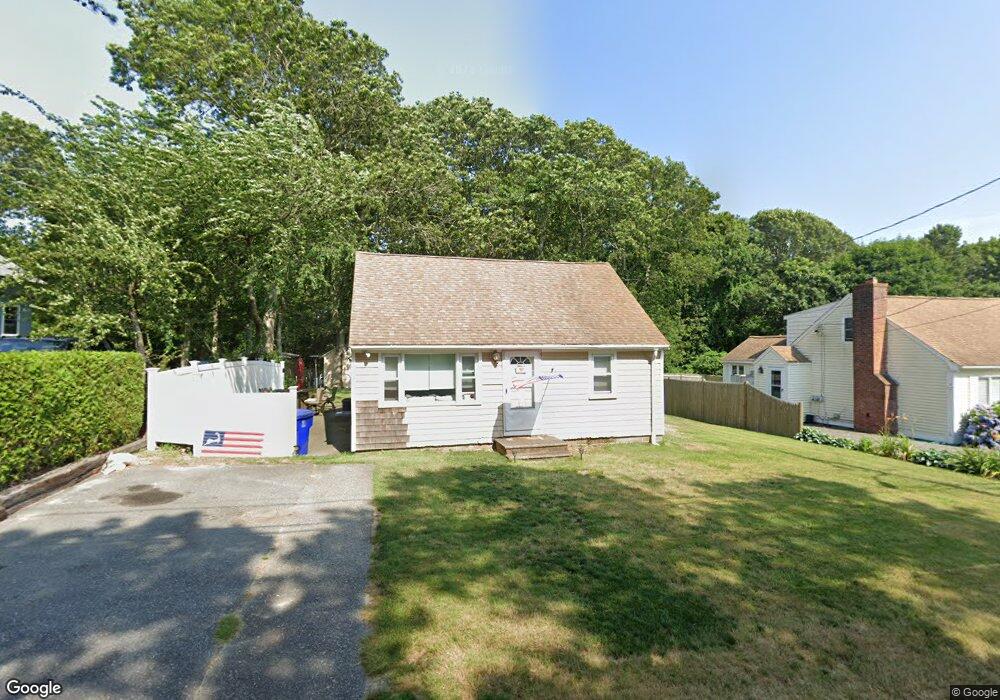
30 Thorne Rd Bourne, MA 2532
Estimated Value: $449,000 - $521,000
2
Beds
1
Bath
972
Sq Ft
$488/Sq Ft
Est. Value
About This Home
This home is located at 30 Thorne Rd, Bourne, MA 2532 and is currently estimated at $474,616, approximately $488 per square foot. 30 Thorne Rd is a home located in Barnstable County with nearby schools including Bourne High School, St Margaret Regional School, and Cadence Academy Preschool - Bourne.
Ownership History
Date
Name
Owned For
Owner Type
Purchase Details
Closed on
Jun 15, 2018
Sold by
Arthur G Ainsworth Ret and Ainsworth
Bought by
Mcnamara Tami L and Kane Michael F
Current Estimated Value
Home Financials for this Owner
Home Financials are based on the most recent Mortgage that was taken out on this home.
Original Mortgage
$232,750
Outstanding Balance
$199,582
Interest Rate
4.5%
Mortgage Type
New Conventional
Estimated Equity
$275,034
Create a Home Valuation Report for This Property
The Home Valuation Report is an in-depth analysis detailing your home's value as well as a comparison with similar homes in the area
Purchase History
| Date | Buyer | Sale Price | Title Company |
|---|---|---|---|
| Mcnamara Tami L | $245,000 | -- | |
| Mcnamara Tami L | $245,000 | -- |
Source: Public Records
Mortgage History
| Date | Status | Borrower | Loan Amount |
|---|---|---|---|
| Open | Mcnamara Tami L | $232,750 | |
| Closed | Mcnamara Tami L | $232,750 |
Source: Public Records
Tax History
| Year | Tax Paid | Tax Assessment Tax Assessment Total Assessment is a certain percentage of the fair market value that is determined by local assessors to be the total taxable value of land and additions on the property. | Land | Improvement |
|---|---|---|---|---|
| 2025 | $3,065 | $392,400 | $233,800 | $158,600 |
| 2024 | $2,997 | $373,700 | $222,700 | $151,000 |
| 2023 | $2,913 | $330,700 | $197,100 | $133,600 |
| 2022 | $2,829 | $280,400 | $174,400 | $106,000 |
| 2021 | $2,749 | $255,200 | $158,700 | $96,500 |
| 2020 | $2,626 | $244,500 | $157,200 | $87,300 |
| 2019 | $2,701 | $257,000 | $174,700 | $82,300 |
| 2018 | $2,657 | $252,100 | $166,400 | $85,700 |
| 2017 | $2,571 | $249,600 | $164,800 | $84,800 |
| 2016 | $2,221 | $218,600 | $148,300 | $70,300 |
| 2015 | $1,980 | $196,600 | $126,300 | $70,300 |
Source: Public Records
Map
Nearby Homes
- 60 Bourne Neck Dr
- 35 Benedict Rd
- 5 Zoli Ln
- 46 Holt Rd Unit B
- 46 Holt Rd
- 203 County Rd
- 13 Laurel Hill Ct
- 40-A Lafayette Ave
- 44 Cotuit Rd
- 4 Van Bummel Rd
- 2 Applewood Ct
- 5 Sea Knoll Ct
- 56 Rip Van Winkle Way
- 60 Sandwich Rd
- 12 Turnberry Rd Unit 12
- 38 Old Bridge Rd
- 3 Honora Ln Unit 3
- 6 Honora Ct
- 4 Hollyhock Knoll Ct Unit 4
- 4 Hollyhock Knoll Ct Unit 4
Your Personal Tour Guide
Ask me questions while you tour the home.