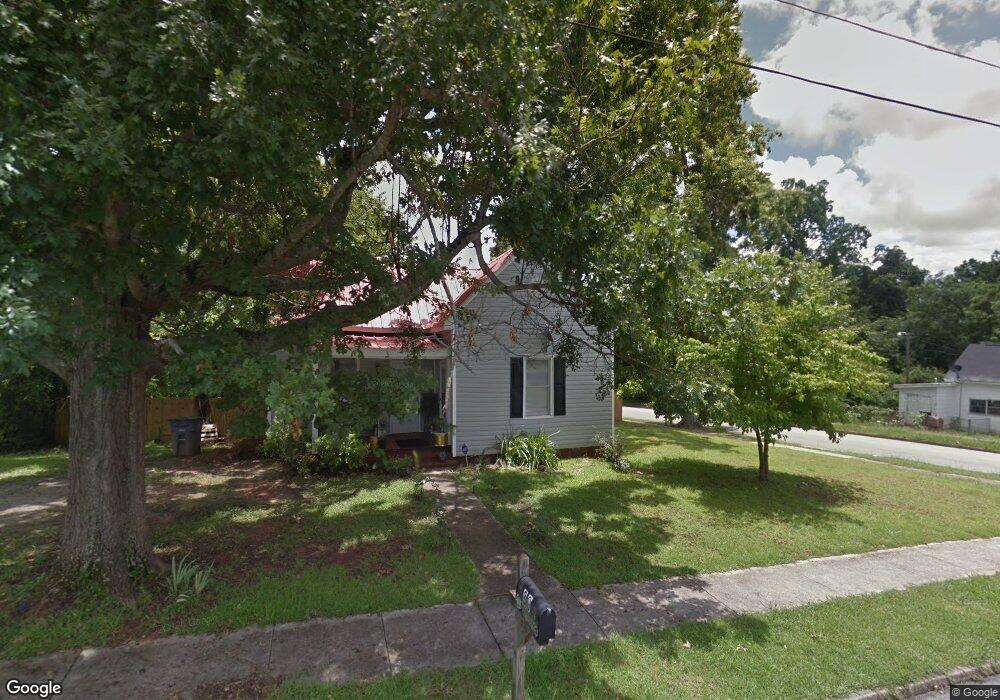
30 Thornton St Lagrange, GA 30241
Estimated Value: $68,000 - $110,988
2
Beds
1
Bath
879
Sq Ft
$99/Sq Ft
Est. Value
About This Home
This home is located at 30 Thornton St, Lagrange, GA 30241 and is currently estimated at $86,747, approximately $98 per square foot. 30 Thornton St is a home located in Troup County with nearby schools including Franklin Forest Elementary School, Hollis Hand Elementary School, and Ethel W. Kight Elementary School.
Ownership History
Date
Name
Owned For
Owner Type
Purchase Details
Closed on
Mar 13, 2012
Bought by
Mcfarland Hartences L
Current Estimated Value
Purchase Details
Closed on
Jul 19, 2011
Sold by
Matthews James R
Bought by
Donz Inc
Home Financials for this Owner
Home Financials are based on the most recent Mortgage that was taken out on this home.
Original Mortgage
$23,648
Interest Rate
4.52%
Mortgage Type
New Conventional
Purchase Details
Closed on
Jul 6, 2010
Sold by
Sobik Michael E
Bought by
Matthews James R
Purchase Details
Closed on
Aug 26, 2002
Sold by
Patricia Ann Payne
Bought by
Abbott & Sobik Acquisitions Ll
Purchase Details
Closed on
Dec 8, 1997
Sold by
Edgar Meadows
Bought by
Patricia Ann Payne
Purchase Details
Closed on
Mar 3, 1997
Sold by
Meadows Nellie
Bought by
Edgar Meadows
Purchase Details
Closed on
Jul 17, 1980
Sold by
Edgar Meadows
Bought by
Meadows Nellie
Purchase Details
Closed on
Aug 1, 1964
Sold by
Dunson Mills
Bought by
Edgar Meadows
Create a Home Valuation Report for This Property
The Home Valuation Report is an in-depth analysis detailing your home's value as well as a comparison with similar homes in the area
Purchase History
| Date | Buyer | Sale Price | Title Company |
|---|---|---|---|
| Mcfarland Hartences L | $32,000 | -- | |
| Donz Inc | $22,500 | -- | |
| Matthews James R | $16,100 | -- | |
| Abbott & Sobik Acquisitions Ll | $22,500 | -- | |
| Patricia Ann Payne | -- | -- | |
| Edgar Meadows | $12,000 | -- | |
| Meadows Nellie | -- | -- | |
| Edgar Meadows | -- | -- |
Source: Public Records
Mortgage History
| Date | Status | Borrower | Loan Amount |
|---|---|---|---|
| Previous Owner | Matthews James R | $23,648 |
Source: Public Records
Tax History
| Year | Tax Paid | Tax Assessment Tax Assessment Total Assessment is a certain percentage of the fair market value that is determined by local assessors to be the total taxable value of land and additions on the property. | Land | Improvement |
|---|---|---|---|---|
| 2025 | $721 | $26,448 | $5,480 | $20,968 |
| 2024 | $660 | $24,208 | $5,480 | $18,728 |
| 2023 | $593 | $21,728 | $5,480 | $16,248 |
| 2022 | $582 | $20,848 | $5,480 | $15,368 |
| 2021 | $463 | $15,340 | $3,080 | $12,260 |
| 2020 | $463 | $15,340 | $3,080 | $12,260 |
| 2019 | $370 | $12,260 | $3,080 | $9,180 |
| 2018 | $358 | $11,864 | $3,136 | $8,728 |
| 2017 | $358 | $11,864 | $3,136 | $8,728 |
| 2016 | $350 | $11,617 | $3,136 | $8,481 |
| 2015 | $351 | $11,617 | $3,136 | $8,481 |
| 2014 | $338 | $11,170 | $3,136 | $8,034 |
| 2013 | -- | $11,785 | $3,136 | $8,649 |
Source: Public Records
Map
Nearby Homes
- 5 Curran Ave
- 204 Cleveland Dr
- 212 Cleveland Dr
- 3 Gulfstream Dr
- 5 Gulfstream Dr
- 4 1/2 Barnard Ave
- 0 N Barnard Ave
- 15 Fulton St
- 115 Clara Jean Ct
- 147 Shenandoah Ln
- 146 Shenandoah Ln
- 107 N Barnard Ave
- 143 Shenandoah Ln
- 141 Shenandoah Ln
- 142 Shenandoah Ln
- 139 Shenandoah Ln
- 110 Lenox Cir
- 87 Youngs Mill Rd
- 136 Shenandoah Ln
- 304 Bridgette Blvd
Your Personal Tour Guide
Ask me questions while you tour the home.