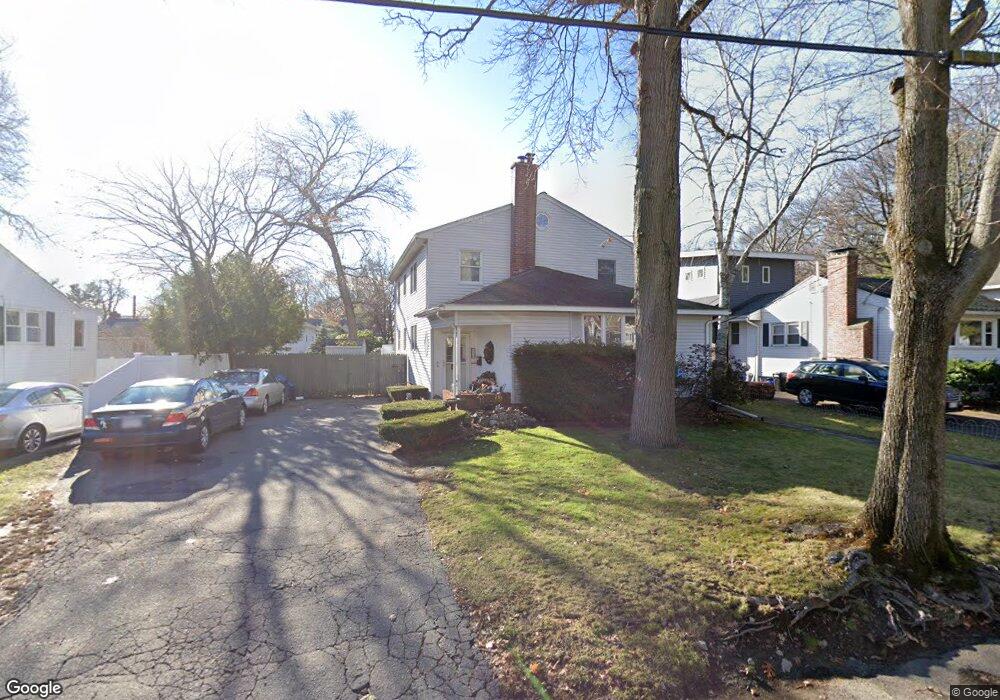
30 Tower Rd Arlington, MA 02474
Arlington Heights NeighborhoodEstimated Value: $1,188,000 - $1,344,000
4
Beds
4
Baths
2,316
Sq Ft
$541/Sq Ft
Est. Value
About This Home
This home is located at 30 Tower Rd, Arlington, MA 02474 and is currently estimated at $1,251,988, approximately $540 per square foot. 30 Tower Rd is a home located in Middlesex County with nearby schools including M. Norcross Stratton Elementary School, Ottoson Middle School, and Arlington High School.
Ownership History
Date
Name
Owned For
Owner Type
Purchase Details
Closed on
Mar 30, 1988
Sold by
Hasson Jonathan E
Bought by
Patti Louis P
Current Estimated Value
Home Financials for this Owner
Home Financials are based on the most recent Mortgage that was taken out on this home.
Original Mortgage
$150,000
Interest Rate
9.89%
Mortgage Type
Purchase Money Mortgage
Create a Home Valuation Report for This Property
The Home Valuation Report is an in-depth analysis detailing your home's value as well as a comparison with similar homes in the area
Home Values in the Area
Average Home Value in this Area
Purchase History
| Date | Buyer | Sale Price | Title Company |
|---|---|---|---|
| Patti Louis P | $195,000 | -- |
Source: Public Records
Mortgage History
| Date | Status | Borrower | Loan Amount |
|---|---|---|---|
| Open | Patti Louis P | $126,500 | |
| Closed | Patti Louis P | $150,000 |
Source: Public Records
Tax History
| Year | Tax Paid | Tax Assessment Tax Assessment Total Assessment is a certain percentage of the fair market value that is determined by local assessors to be the total taxable value of land and additions on the property. | Land | Improvement |
|---|---|---|---|---|
| 2025 | $10,334 | $959,500 | $503,100 | $456,400 |
| 2024 | $9,795 | $924,900 | $497,000 | $427,900 |
| 2023 | $9,403 | $838,800 | $447,900 | $390,900 |
| 2022 | $8,956 | $784,200 | $429,500 | $354,700 |
| 2021 | $8,773 | $773,600 | $429,500 | $344,100 |
| 2020 | $9,591 | $773,600 | $429,500 | $344,100 |
| 2019 | $7,928 | $704,100 | $435,600 | $268,500 |
| 2018 | $7,200 | $593,600 | $325,200 | $268,400 |
| 2017 | $7,070 | $562,900 | $294,500 | $268,400 |
| 2016 | $7,048 | $550,600 | $282,200 | $268,400 |
| 2015 | $6,791 | $501,200 | $239,300 | $261,900 |
Source: Public Records
Map
Nearby Homes
- 337 Washington St
- 92 Overlook Rd
- 69 Edmund Rd
- 281 Forest St
- 11 Lorraine Terrace
- 455-457 Summer St
- 455 Summer St Unit 455
- 143 Wright St
- 7 Bow St
- 12 Elwern Rd
- 0 Dothan St
- 66 Hutchinson Rd
- 4 Beck Rd
- 10 Viking Rd
- 39 Forest St Unit 39A
- 72 Thesda St
- 37 Mayflower Rd
- 8 Old Colony Ln Unit 2
- 11 Lowell St Unit B
- 97 Bow St
Your Personal Tour Guide
Ask me questions while you tour the home.