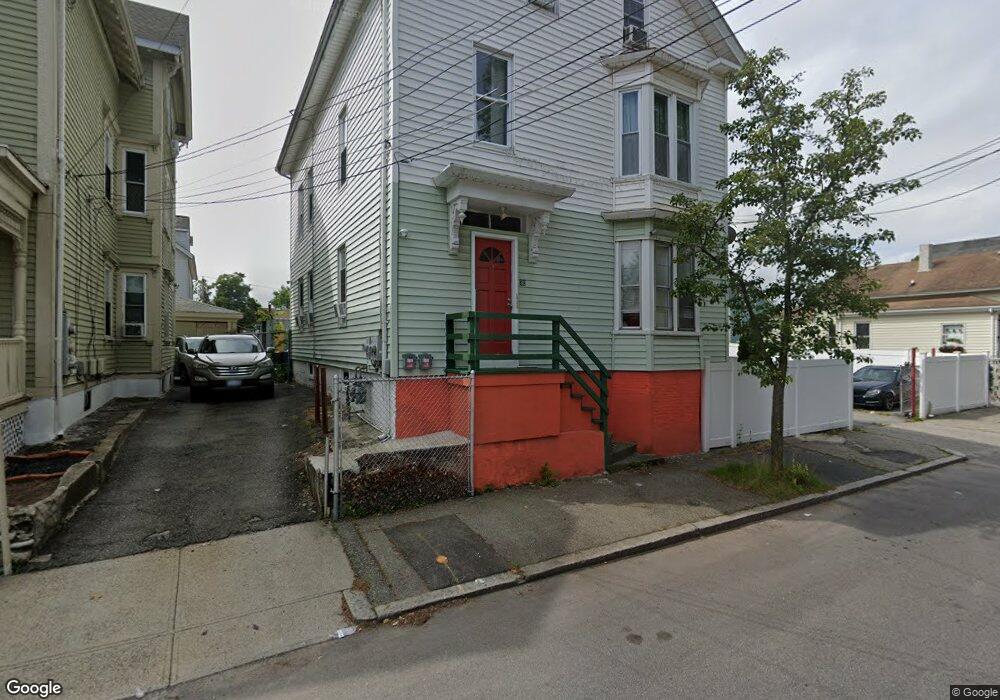
30 Trask St Providence, RI 02905
Lower South Providence NeighborhoodEstimated Value: $542,000 - $658,000
6
Beds
2
Baths
3,020
Sq Ft
$199/Sq Ft
Est. Value
About This Home
This home is located at 30 Trask St, Providence, RI 02905 and is currently estimated at $600,000, approximately $198 per square foot. 30 Trask St is a home located in Providence County with nearby schools including The Hope Academy, Bishop Mcvinney Elementary School, and Community Preparatory School.
Ownership History
Date
Name
Owned For
Owner Type
Purchase Details
Closed on
Jun 11, 2019
Sold by
Guiterrez Alex P
Bought by
Guiterrez Alexandra P and Hernandez Lidia
Current Estimated Value
Purchase Details
Closed on
May 27, 2010
Sold by
Department Of Housing & Urban Dev
Bought by
Pardo Alex
Home Financials for this Owner
Home Financials are based on the most recent Mortgage that was taken out on this home.
Original Mortgage
$37,600
Interest Rate
5.13%
Mortgage Type
Purchase Money Mortgage
Purchase Details
Closed on
Feb 22, 2010
Sold by
Bank Of New York Mello
Bought by
Department Of Housing & Urban Dev
Purchase Details
Closed on
Oct 26, 2009
Sold by
Soko Dukuly M
Bought by
Bank Of New York
Purchase Details
Closed on
Dec 10, 2003
Sold by
Yeater Ronald J and Yeater Rose
Bought by
Soko Dakuly M
Create a Home Valuation Report for This Property
The Home Valuation Report is an in-depth analysis detailing your home's value as well as a comparison with similar homes in the area
Home Values in the Area
Average Home Value in this Area
Purchase History
| Date | Buyer | Sale Price | Title Company |
|---|---|---|---|
| Guiterrez Alexandra P | -- | -- | |
| Pardo Alex | $55,000 | -- | |
| Department Of Housing & Urban Dev | -- | -- | |
| Bank Of New York | $224,825 | -- | |
| Soko Dakuly M | $190,000 | -- |
Source: Public Records
Mortgage History
| Date | Status | Borrower | Loan Amount |
|---|---|---|---|
| Previous Owner | Soko Dakuly M | $37,600 | |
| Previous Owner | Soko Dakuly M | $19,998 |
Source: Public Records
Tax History
| Year | Tax Paid | Tax Assessment Tax Assessment Total Assessment is a certain percentage of the fair market value that is determined by local assessors to be the total taxable value of land and additions on the property. | Land | Improvement |
|---|---|---|---|---|
| 2025 | $3,628 | $480,500 | $123,600 | $356,900 |
| 2024 | $5,811 | $316,700 | $78,300 | $238,400 |
| 2023 | $5,811 | $316,700 | $78,300 | $238,400 |
| 2022 | $5,637 | $316,700 | $78,300 | $238,400 |
| 2021 | $4,563 | $185,800 | $36,700 | $149,100 |
| 2020 | $4,563 | $185,800 | $36,700 | $149,100 |
| 2019 | $4,563 | $185,800 | $36,700 | $149,100 |
| 2018 | $4,880 | $152,700 | $33,400 | $119,300 |
| 2017 | $4,880 | $152,700 | $33,400 | $119,300 |
| 2016 | $4,880 | $152,700 | $33,400 | $119,300 |
| 2015 | $4,478 | $135,300 | $33,400 | $101,900 |
| 2014 | $4,566 | $135,300 | $33,400 | $101,900 |
| 2013 | $4,566 | $135,300 | $33,400 | $101,900 |
Source: Public Records
Map
Nearby Homes
Your Personal Tour Guide
Ask me questions while you tour the home.