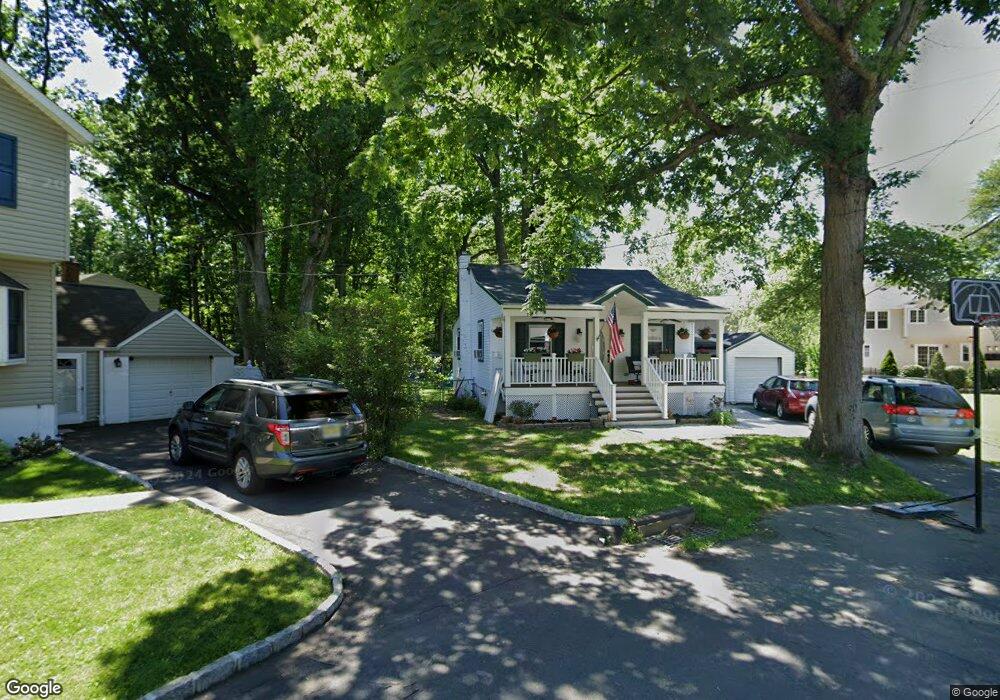
30 Tulip Ct Kenilworth, NJ 07033
Estimated Value: $439,000 - $510,000
2
Beds
2
Baths
884
Sq Ft
$525/Sq Ft
Est. Value
About This Home
This home is located at 30 Tulip Ct, Kenilworth, NJ 07033 and is currently estimated at $464,028, approximately $524 per square foot. 30 Tulip Ct is a home located in Union County with nearby schools including Harding Elementary School, David Brearley High School, and St. Theresa School.
Ownership History
Date
Name
Owned For
Owner Type
Purchase Details
Closed on
Dec 20, 2024
Sold by
Dunn Stephen and Dunn Samantha
Bought by
Malone Kyle and Quaglia Daniella
Current Estimated Value
Home Financials for this Owner
Home Financials are based on the most recent Mortgage that was taken out on this home.
Original Mortgage
$451,250
Outstanding Balance
$447,694
Interest Rate
6.78%
Mortgage Type
New Conventional
Estimated Equity
$16,334
Purchase Details
Closed on
Jan 13, 2017
Sold by
Saeger Jane L
Bought by
Dunn Stephen and Dunn Samantha
Create a Home Valuation Report for This Property
The Home Valuation Report is an in-depth analysis detailing your home's value as well as a comparison with similar homes in the area
Home Values in the Area
Average Home Value in this Area
Purchase History
| Date | Buyer | Sale Price | Title Company |
|---|---|---|---|
| Malone Kyle | $475,000 | Two Rivers Title | |
| Malone Kyle | $475,000 | Two Rivers Title | |
| Malone Kyle | $475,000 | Two Rivers Title | |
| Dunn Stephen | $177,000 | Acres Land Title Agency Inc |
Source: Public Records
Mortgage History
| Date | Status | Borrower | Loan Amount |
|---|---|---|---|
| Open | Malone Kyle | $451,250 | |
| Closed | Malone Kyle | $451,250 |
Source: Public Records
Tax History Compared to Growth
Tax History
| Year | Tax Paid | Tax Assessment Tax Assessment Total Assessment is a certain percentage of the fair market value that is determined by local assessors to be the total taxable value of land and additions on the property. | Land | Improvement |
|---|---|---|---|---|
| 2025 | $9,945 | $155,800 | $82,800 | $73,000 |
| 2024 | $8,951 | $155,800 | $82,800 | $73,000 |
| 2023 | $8,951 | $155,800 | $82,800 | $73,000 |
| 2022 | $8,332 | $155,800 | $82,800 | $73,000 |
| 2021 | $8,119 | $155,800 | $82,800 | $73,000 |
| 2020 | $7,983 | $155,800 | $82,800 | $73,000 |
| 2019 | $7,449 | $147,500 | $82,800 | $64,700 |
| 2018 | $7,241 | $147,500 | $82,800 | $64,700 |
| 2017 | $7,189 | $147,500 | $82,800 | $64,700 |
| 2016 | $7,073 | $147,500 | $82,800 | $64,700 |
| 2015 | $6,885 | $147,500 | $82,800 | $64,700 |
| 2014 | $6,601 | $147,500 | $82,800 | $64,700 |
Source: Public Records
Map
Nearby Homes