Estimated Value: $336,000 - $404,000
3
Beds
1
Bath
1,268
Sq Ft
$287/Sq Ft
Est. Value
About This Home
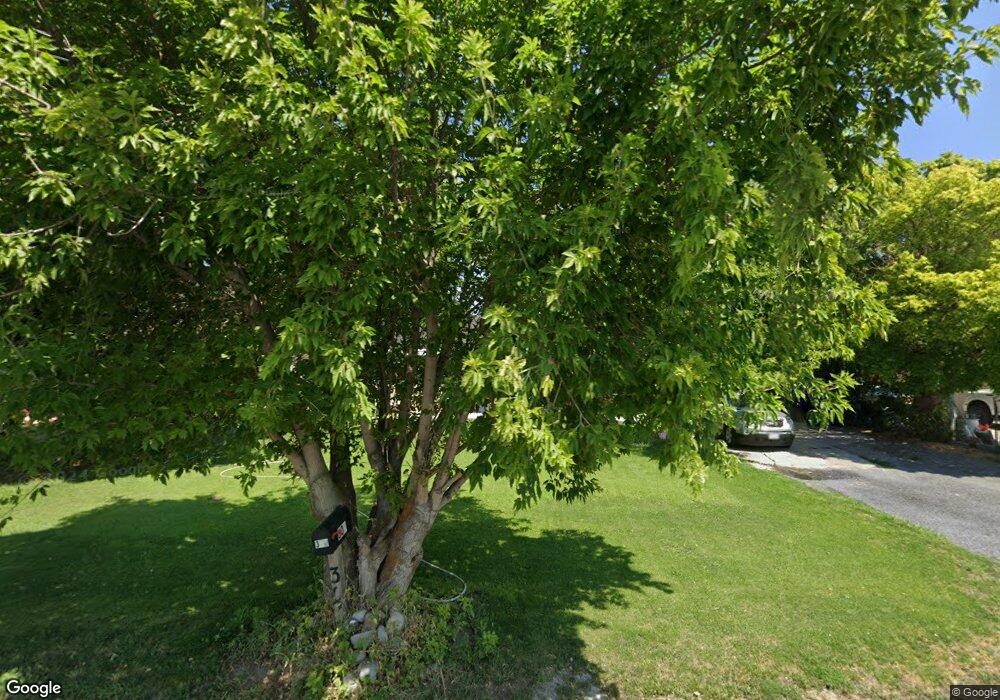
This home is located at 30 W 100 N, Hyrum, UT 84319 and is currently estimated at $363,333, approximately $286 per square foot. 30 W 100 N is a home located in Cache County with nearby schools including Lincoln School, South Cache Middle School, and Mountain Crest High School.
Ownership History
Date
Name
Owned For
Owner Type
Purchase Details
Closed on
Sep 14, 2020
Sold by
Faucette Floyd E and Faucette Roberta A
Bought by
Castaneda Angelia Mendez and Rogel Susana Arce
Current Estimated Value
Purchase Details
Closed on
Dec 20, 2012
Sold by
Faucette Donavan and Faucette Elise
Bought by
Faucette Floyd E and Faucette Roberta A
Home Financials for this Owner
Home Financials are based on the most recent Mortgage that was taken out on this home.
Original Mortgage
$99,200
Interest Rate
3.37%
Mortgage Type
New Conventional
Purchase Details
Closed on
Jul 30, 2008
Sold by
Rozanski Mark
Bought by
Faucette Donavan and Faucette Elise
Home Financials for this Owner
Home Financials are based on the most recent Mortgage that was taken out on this home.
Original Mortgage
$118,830
Interest Rate
6.41%
Mortgage Type
New Conventional
Purchase Details
Closed on
Mar 15, 2006
Sold by
Rozanski Tracy
Bought by
Rozanski Mark
Create a Home Valuation Report for This Property
The Home Valuation Report is an in-depth analysis detailing your home's value as well as a comparison with similar homes in the area
Home Values in the Area
Average Home Value in this Area
Purchase History
| Date | Buyer | Sale Price | Title Company |
|---|---|---|---|
| Castaneda Angelia Mendez | -- | None Available | |
| Faucette Floyd E | -- | Titan Title Insurance Agency | |
| Faucette Donavan | -- | Heritage Title | |
| Rozanski Mark | -- | None Available |
Source: Public Records
Mortgage History
| Date | Status | Borrower | Loan Amount |
|---|---|---|---|
| Previous Owner | Faucette Floyd E | $99,200 | |
| Previous Owner | Faucette Donavan | $118,830 |
Source: Public Records
Tax History Compared to Growth
Tax History
| Year | Tax Paid | Tax Assessment Tax Assessment Total Assessment is a certain percentage of the fair market value that is determined by local assessors to be the total taxable value of land and additions on the property. | Land | Improvement |
|---|---|---|---|---|
| 2025 | $117 | $167,495 | $0 | $0 |
| 2024 | $124 | $166,855 | $0 | $0 |
| 2023 | $1,444 | $185,155 | $0 | $0 |
| 2022 | $151 | $185,160 | $0 | $0 |
| 2021 | $1,409 | $265,090 | $63,440 | $201,650 |
| 2020 | $1,243 | $219,040 | $63,440 | $155,600 |
| 2019 | $1,156 | $191,395 | $35,795 | $155,600 |
| 2018 | $978 | $157,987 | $35,795 | $122,192 |
| 2017 | $951 | $79,690 | $0 | $0 |
| 2016 | $972 | $69,020 | $0 | $0 |
| 2015 | $844 | $69,020 | $0 | $0 |
| 2014 | $821 | $68,605 | $0 | $0 |
| 2013 | -- | $56,380 | $0 | $0 |
Source: Public Records
Map
Nearby Homes