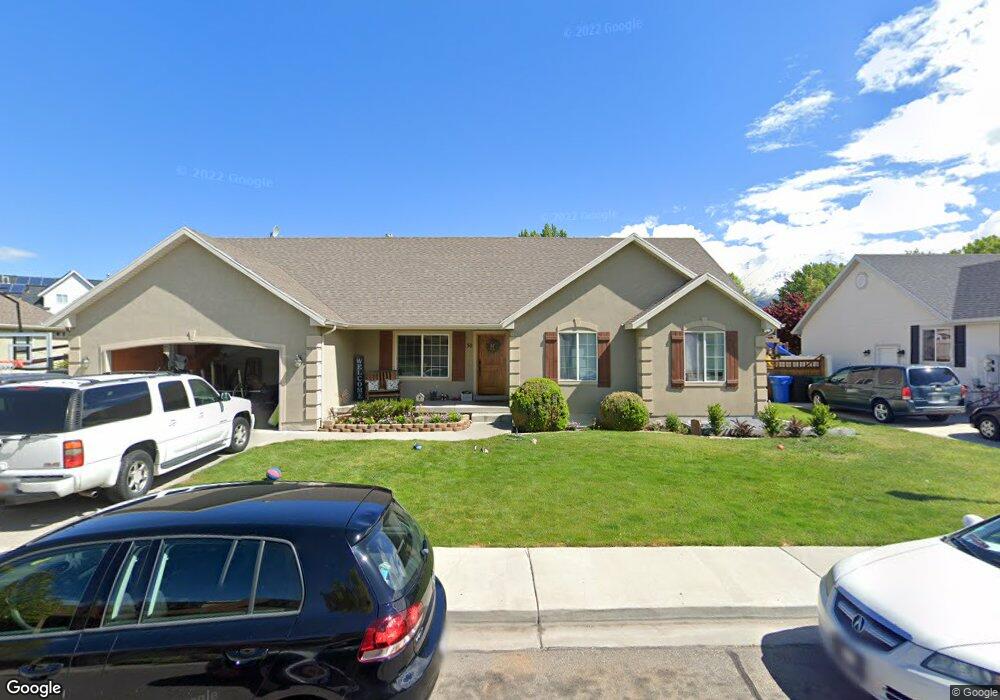
30 W 720 S Orem, UT 84058
Orem South NeighborhoodEstimated Value: $574,000 - $620,000
3
Beds
3
Baths
1,830
Sq Ft
$329/Sq Ft
Est. Value
About This Home
This home is located at 30 W 720 S, Orem, UT 84058 and is currently estimated at $601,407, approximately $328 per square foot. 30 W 720 S is a home located in Utah County with nearby schools including Westmore Elementary School, Lakeridge Jr High School, and Mountain View High School.
Ownership History
Date
Name
Owned For
Owner Type
Purchase Details
Closed on
Oct 8, 2020
Sold by
Evans Malcolm Stanley and Evans Cindy Lee
Bought by
Evans Malcolm Stanley and Evans Cindy Lee
Current Estimated Value
Home Financials for this Owner
Home Financials are based on the most recent Mortgage that was taken out on this home.
Original Mortgage
$264,975
Outstanding Balance
$235,681
Interest Rate
2.9%
Mortgage Type
New Conventional
Estimated Equity
$365,726
Purchase Details
Closed on
Aug 7, 2002
Sold by
Hansen Bradley C and Hansen Chelsa L
Bought by
Hansen Bradley C and Hansen Chelsa L
Purchase Details
Closed on
Aug 27, 2001
Sold by
Hair Moroni W and Hair Emily
Bought by
Hansen Bradley C and Hansen Chelsea L
Home Financials for this Owner
Home Financials are based on the most recent Mortgage that was taken out on this home.
Original Mortgage
$237,000
Interest Rate
7.21%
Mortgage Type
Seller Take Back
Create a Home Valuation Report for This Property
The Home Valuation Report is an in-depth analysis detailing your home's value as well as a comparison with similar homes in the area
Home Values in the Area
Average Home Value in this Area
Purchase History
| Date | Buyer | Sale Price | Title Company |
|---|---|---|---|
| Evans Malcolm Stanley | -- | None Available | |
| Hansen Bradley C | -- | Old Republic Title | |
| Hansen Bradley C | -- | -- |
Source: Public Records
Mortgage History
| Date | Status | Borrower | Loan Amount |
|---|---|---|---|
| Open | Evans Malcolm Stanley | $264,975 | |
| Closed | Hansen Bradley C | $237,000 |
Source: Public Records
Tax History
| Year | Tax Paid | Tax Assessment Tax Assessment Total Assessment is a certain percentage of the fair market value that is determined by local assessors to be the total taxable value of land and additions on the property. | Land | Improvement |
|---|---|---|---|---|
| 2025 | $2,589 | $322,960 | -- | -- |
| 2024 | $2,589 | $316,580 | $0 | $0 |
| 2023 | $2,432 | $319,660 | $0 | $0 |
| 2022 | $2,338 | $297,660 | $0 | $0 |
| 2021 | $2,178 | $420,100 | $176,100 | $244,000 |
| 2020 | $2,005 | $380,100 | $140,900 | $239,200 |
| 2019 | $1,873 | $369,200 | $130,000 | $239,200 |
| 2018 | $1,849 | $348,200 | $112,000 | $236,200 |
| 2017 | $1,655 | $166,925 | $0 | $0 |
| 2016 | $1,773 | $164,945 | $0 | $0 |
| 2015 | $1,687 | $148,445 | $0 | $0 |
| 2014 | $1,659 | $145,255 | $0 | $0 |
Source: Public Records
Map
Nearby Homes
Your Personal Tour Guide
Ask me questions while you tour the home.