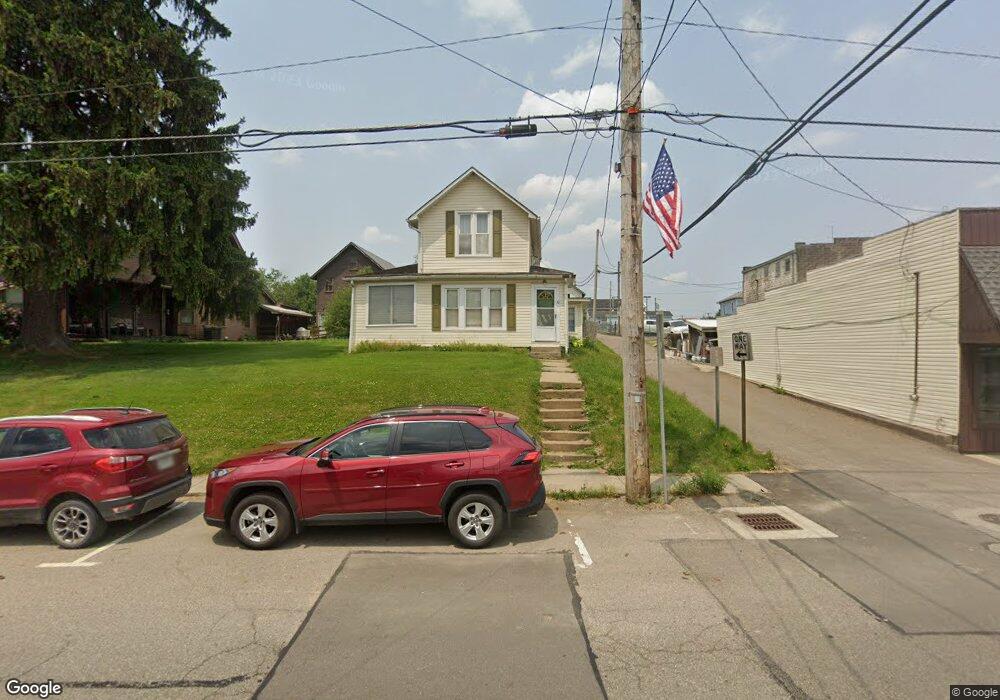
30 W Elm St Butler, OH 44822
Estimated Value: $152,479 - $189,000
3
Beds
2
Baths
1,492
Sq Ft
$118/Sq Ft
Est. Value
About This Home
This home is located at 30 W Elm St, Butler, OH 44822 and is currently estimated at $175,620, approximately $117 per square foot. 30 W Elm St is a home located in Richland County with nearby schools including Clear Fork High School.
Ownership History
Date
Name
Owned For
Owner Type
Purchase Details
Closed on
Mar 21, 2013
Sold by
Midfirst Bank
Bought by
Wade Steven R and Wade Margaret
Current Estimated Value
Purchase Details
Closed on
Aug 15, 2012
Sold by
Secretary Of Veterans Affairs
Bought by
Midfirst Bank
Purchase Details
Closed on
Jan 31, 2012
Sold by
Collins Steven
Bought by
Secretary Of Veterans Affairs
Purchase Details
Closed on
May 22, 2002
Sold by
Lyon William F
Bought by
Collins Steven and Collins Ruth
Home Financials for this Owner
Home Financials are based on the most recent Mortgage that was taken out on this home.
Original Mortgage
$87,210
Interest Rate
7.07%
Mortgage Type
VA
Purchase Details
Closed on
Dec 7, 1994
Sold by
Sansom Keith A
Bought by
Pore Gary G and Pore Juanita S
Home Financials for this Owner
Home Financials are based on the most recent Mortgage that was taken out on this home.
Original Mortgage
$30,500
Interest Rate
9.06%
Mortgage Type
New Conventional
Purchase Details
Closed on
Oct 1, 1985
Create a Home Valuation Report for This Property
The Home Valuation Report is an in-depth analysis detailing your home's value as well as a comparison with similar homes in the area
Home Values in the Area
Average Home Value in this Area
Purchase History
| Date | Buyer | Sale Price | Title Company |
|---|---|---|---|
| Wade Steven R | $26,000 | American Homeland Title Agen | |
| Midfirst Bank | -- | American Homeland Title Agen | |
| Secretary Of Veterans Affairs | -- | None Available | |
| Collins Steven | $85,500 | -- | |
| Pore Gary G | $41,000 | -- | |
| -- | $25,000 | -- |
Source: Public Records
Mortgage History
| Date | Status | Borrower | Loan Amount |
|---|---|---|---|
| Previous Owner | Collins Steven | $87,210 | |
| Previous Owner | Pore Gary G | $30,500 |
Source: Public Records
Tax History Compared to Growth
Tax History
| Year | Tax Paid | Tax Assessment Tax Assessment Total Assessment is a certain percentage of the fair market value that is determined by local assessors to be the total taxable value of land and additions on the property. | Land | Improvement |
|---|---|---|---|---|
| 2024 | $668 | $32,490 | $3,380 | $29,110 |
| 2023 | $668 | $32,490 | $3,380 | $29,110 |
| 2022 | $1,090 | $25,160 | $3,210 | $21,950 |
| 2021 | $1,176 | $25,160 | $3,210 | $21,950 |
| 2020 | $1,176 | $25,160 | $3,210 | $21,950 |
| 2019 | $1,059 | $21,330 | $2,720 | $18,610 |
| 2018 | $1,050 | $21,330 | $2,720 | $18,610 |
| 2017 | $707 | $21,330 | $2,720 | $18,610 |
| 2016 | $422 | $9,140 | $2,720 | $6,420 |
| 2015 | $422 | $9,140 | $2,720 | $6,420 |
| 2014 | $421 | $9,140 | $2,720 | $6,420 |
| 2012 | $1,146 | $25,630 | $2,720 | $22,910 |
Source: Public Records
Map
Nearby Homes
- 3898 Ohio 97
- 128 College St
- 224 Blue Bird Dr
- 5449 Hagerman Rd
- 1259 State Route 97 E
- 1260 Ohio 97 Unit 115
- 2070 Riggle Rd
- 1169 State Route 97 E
- 4978 Bott Rd
- 5042 Possum Run Rd
- 21625 N Liberty Rd
- 4234 Swigart Rd
- 4169 State Route 97
- 0 Mishey Rd
- 361 Honey Creek Rd E
- 6533 Durbin Rd
- 0 Kenton Rd
- 6509 Ankneytown Rd
- 6902 Ankneytown Rd
- 70 Betty Dr