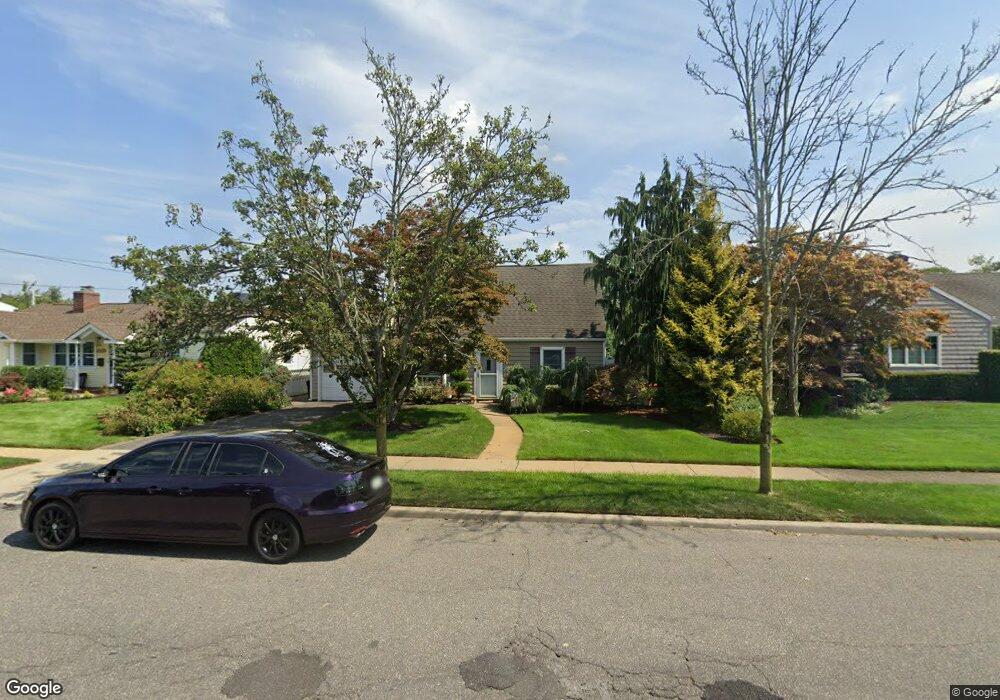
30 W Shore Dr Massapequa, NY 11758
Estimated Value: $722,000 - $739,213
--
Bed
2
Baths
1,953
Sq Ft
$374/Sq Ft
Est. Value
About This Home
This home is located at 30 W Shore Dr, Massapequa, NY 11758 and is currently estimated at $730,607, approximately $374 per square foot. 30 W Shore Dr is a home located in Nassau County with nearby schools including Berner Middle School, Massapequa High School - Ames Campus, and Massapequa High School.
Ownership History
Date
Name
Owned For
Owner Type
Purchase Details
Closed on
May 28, 2009
Sold by
Novello Anthony
Bought by
Rodaligo Frank
Current Estimated Value
Purchase Details
Closed on
Apr 21, 2000
Purchase Details
Closed on
Aug 25, 1999
Sold by
Heuer Shirley
Bought by
Novello Anthony Thomas and Bonini Kimberly Ann
Home Financials for this Owner
Home Financials are based on the most recent Mortgage that was taken out on this home.
Original Mortgage
$156,500
Interest Rate
7.85%
Mortgage Type
Purchase Money Mortgage
Create a Home Valuation Report for This Property
The Home Valuation Report is an in-depth analysis detailing your home's value as well as a comparison with similar homes in the area
Home Values in the Area
Average Home Value in this Area
Purchase History
| Date | Buyer | Sale Price | Title Company |
|---|---|---|---|
| Rodaligo Frank | $420,000 | -- | |
| -- | -- | -- | |
| Novello Anthony Thomas | $226,500 | -- |
Source: Public Records
Mortgage History
| Date | Status | Borrower | Loan Amount |
|---|---|---|---|
| Previous Owner | Novello Anthony Thomas | $156,500 |
Source: Public Records
Tax History Compared to Growth
Tax History
| Year | Tax Paid | Tax Assessment Tax Assessment Total Assessment is a certain percentage of the fair market value that is determined by local assessors to be the total taxable value of land and additions on the property. | Land | Improvement |
|---|---|---|---|---|
| 2025 | $10,883 | $437 | $197 | $240 |
| 2024 | $3,213 | $446 | $201 | $245 |
| 2023 | $10,171 | $446 | $201 | $245 |
| 2022 | $10,171 | $446 | $201 | $245 |
| 2021 | $10,015 | $446 | $200 | $246 |
| 2020 | $10,330 | $676 | $660 | $16 |
| 2019 | $10,120 | $724 | $554 | $170 |
| 2018 | $10,022 | $772 | $0 | $0 |
| 2017 | $7,751 | $924 | $707 | $217 |
| 2016 | $11,690 | $924 | $707 | $217 |
| 2015 | $3,508 | $924 | $707 | $217 |
| 2014 | $3,508 | $924 | $707 | $217 |
| 2013 | $3,187 | $924 | $707 | $217 |
Source: Public Records
Map
Nearby Homes