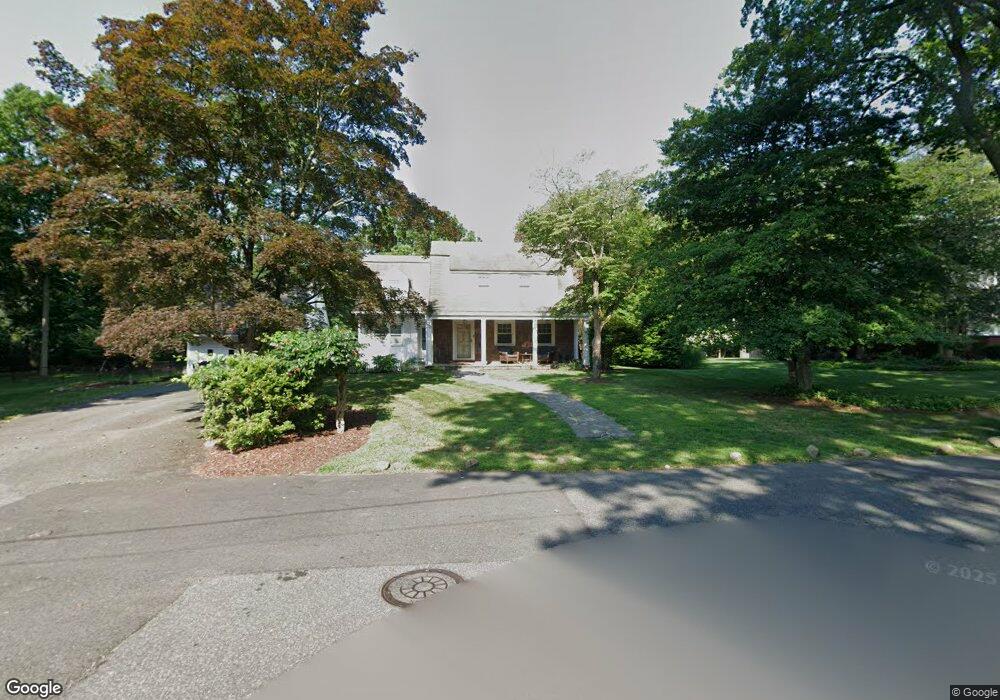
30 Walnut Place Allendale, NJ 07401
Estimated Value: $733,000 - $963,000
--
Bed
--
Bath
1,740
Sq Ft
$504/Sq Ft
Est. Value
About This Home
This home is located at 30 Walnut Place, Allendale, NJ 07401 and is currently estimated at $877,595, approximately $504 per square foot. 30 Walnut Place is a home located in Bergen County with nearby schools including Hillside Elementary School, Brookside Elementary School, and Northern Highlands Reg High School.
Ownership History
Date
Name
Owned For
Owner Type
Purchase Details
Closed on
Sep 7, 2018
Sold by
Moore Glenn C and Mascola Marie
Bought by
Mascola Marie
Current Estimated Value
Purchase Details
Closed on
Oct 28, 2014
Sold by
Reeder Donald W and Estate Of Mary Louise Beresfor
Bought by
Moore Glenn C and Mascola Marie
Home Financials for this Owner
Home Financials are based on the most recent Mortgage that was taken out on this home.
Original Mortgage
$384,000
Interest Rate
4.17%
Mortgage Type
New Conventional
Purchase Details
Closed on
Jan 26, 1999
Sold by
Beresford Mary Louise
Bought by
Ogden Beresford C and Beresford Mary Louise
Create a Home Valuation Report for This Property
The Home Valuation Report is an in-depth analysis detailing your home's value as well as a comparison with similar homes in the area
Home Values in the Area
Average Home Value in this Area
Purchase History
| Date | Buyer | Sale Price | Title Company |
|---|---|---|---|
| Mascola Marie | -- | -- | |
| Moore Glenn C | $480,000 | Attorney | |
| Ogden Beresford C | -- | -- |
Source: Public Records
Mortgage History
| Date | Status | Borrower | Loan Amount |
|---|---|---|---|
| Previous Owner | Moore Glenn C | $384,000 |
Source: Public Records
Tax History Compared to Growth
Tax History
| Year | Tax Paid | Tax Assessment Tax Assessment Total Assessment is a certain percentage of the fair market value that is determined by local assessors to be the total taxable value of land and additions on the property. | Land | Improvement |
|---|---|---|---|---|
| 2025 | $14,866 | $740,800 | $498,500 | $242,300 |
| 2024 | $13,513 | $704,900 | $476,000 | $228,900 |
| 2023 | $13,120 | $614,500 | $391,000 | $223,500 |
| 2022 | $13,120 | $576,200 | $363,500 | $212,700 |
| 2021 | $13,114 | $558,300 | $351,000 | $207,300 |
| 2020 | $13,001 | $538,800 | $341,000 | $197,800 |
| 2019 | $12,656 | $538,800 | $341,000 | $197,800 |
| 2018 | $12,376 | $538,800 | $341,000 | $197,800 |
| 2017 | $12,328 | $538,800 | $341,000 | $197,800 |
| 2016 | $12,344 | $538,800 | $341,000 | $197,800 |
| 2015 | $11,759 | $523,800 | $341,000 | $182,800 |
| 2014 | $11,255 | $482,800 | $331,000 | $151,800 |
Source: Public Records
Map
Nearby Homes
- 723 W Crescent Ave
- 65 New St
- 65 Park Ave
- 77 Myrtle Ave
- 24 Scott Ct
- 103 Macintyre Ln
- 45 W Orchard St
- 1406 Whitney Ln
- 22 Oakwood Rd
- 1508 Whitney Ln
- 17 Allison Ct
- 2 Allison Ct Unit C0002
- 6 Cottage Place
- 36 Lockwood Dr
- 90 Arcadia Rd
- 24 Vanderbeck Ln
- 314 Meadowbrook Rd
- 1-5 Chestnut Place
- 103 Crescent Ave
- 93 Frost Ln