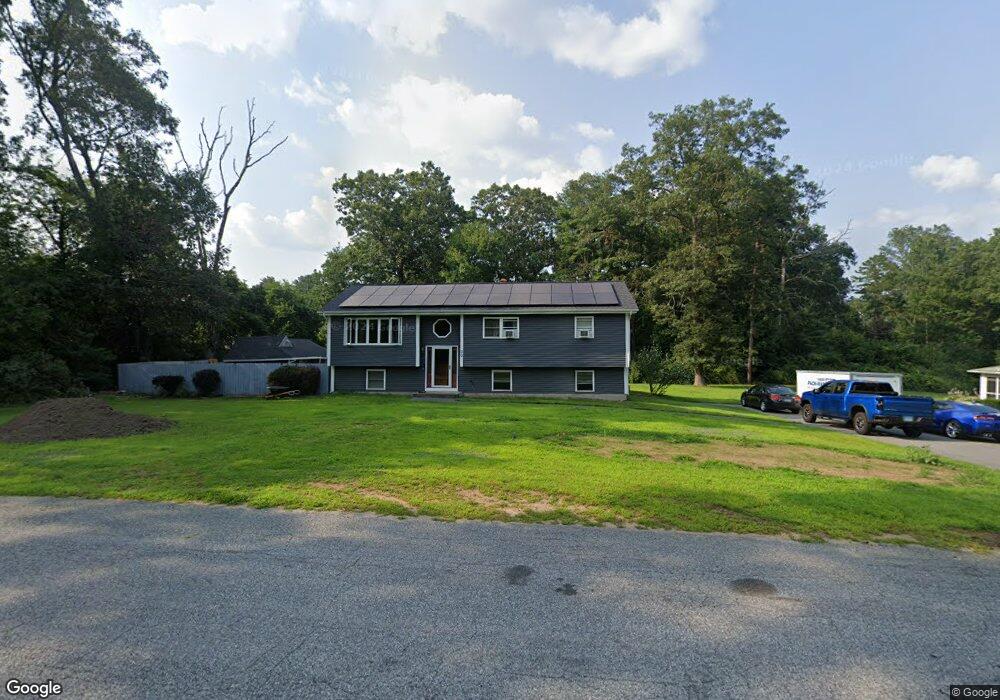
30 Waterman St Danielson, CT 06239
Estimated Value: $361,000 - $369,000
About This Home
This home is located at 30 Waterman St, Danielson, CT 06239 and is currently estimated at $365,555, approximately $285 per square foot. 30 Waterman St is a home located in Windham County with nearby schools including Killingly Central School, Killingly Memorial School, and Killingly Intermediate School.
Ownership History
We collect this data history from publicly available records. To have your information removed, we recommend requesting removal directly through your county’s website.
Purchase Details
Home Financials for this Owner
Home Financials are based on the most recent Mortgage that was taken out on this home.Purchase Details
Home Financials for this Owner
Home Financials are based on the most recent Mortgage that was taken out on this home.Purchase Details
Home Values in the Area
Average Home Value in this Area
Purchase History
We collect this data history from publicly available records. To have your information removed, we recommend requesting removal directly through your county’s website.
| Date | Buyer | Sale Price | Title Company |
|---|---|---|---|
| $223,000 | None Available | ||
| $223,000 | None Available | ||
| $245,000 | -- | ||
| $245,000 | -- | ||
| $135,000 | -- |
Mortgage History
We collect this data history from publicly available records. To have your information removed, we recommend requesting removal directly through your county’s website.
| Date | Status | Borrower | Loan Amount |
|---|---|---|---|
| Open | $218,960 | ||
| Closed | $218,960 | ||
| Previous Owner | $196,000 | ||
| Previous Owner | $126,000 |
Tax History
We collect this data history from publicly available records. To have your information removed, we recommend requesting removal directly through your county’s website.
| Year | Tax Paid | Tax Assessment Tax Assessment Total Assessment is a certain percentage of the fair market value that is determined by local assessors to be the total taxable value of land and additions on the property. | Land | Improvement |
|---|---|---|---|---|
| 2025 | $4,501 | $193,680 | $37,580 | $156,100 |
| 2024 | $4,193 | $189,640 | $37,580 | $152,060 |
| 2023 | $3,697 | $127,170 | $30,940 | $96,230 |
| 2022 | $3,476 | $127,170 | $30,940 | $96,230 |
| 2021 | $3,455 | $126,840 | $30,940 | $95,900 |
| 2020 | $3,392 | $126,840 | $30,940 | $95,900 |
| 2019 | $3,445 | $126,840 | $30,940 | $95,900 |
| 2017 | $2,944 | $102,550 | $23,940 | $78,610 |
| 2016 | $2,944 | $102,550 | $23,940 | $78,610 |
| 2015 | $2,944 | $102,550 | $23,940 | $78,610 |
| 2014 | $2,862 | $102,550 | $23,940 | $78,610 |
Map
- 46 Taos Dr
- 5 King St
- 34 Robert Ave
- 247 Green Hollow Rd
- 12 Red Oak Dr
- 56 Salmon Dr
- 15 Salmon Dr
- 85 Wauregan Rd
- 43 Fall Brook Rd
- 316 Allen Hill Rd
- 22 South St
- 16 South St
- 20 Wauregan Rd
- 17 Plainview Dr
- 193 E Franklin St
- 53 S Main St
- 81 Grand View Terrace
- 0 Allen Hill Rd Unit 24140370
- 35 S Main St
- 87 Grand View Terrace
Ask me questions while you tour the home.