Estimated Value: $339,000 - $414,000
4
Beds
2
Baths
2,308
Sq Ft
$160/Sq Ft
Est. Value
About This Home
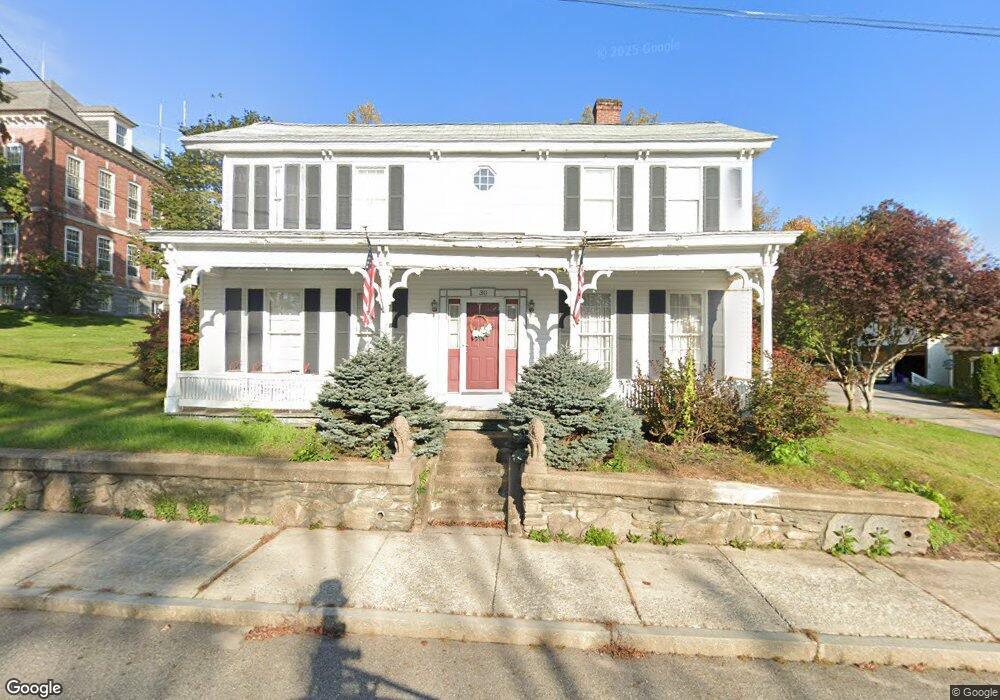
This home is located at 30 West St, Barre, MA 01005 and is currently estimated at $369,704, approximately $160 per square foot. 30 West St is a home located in Worcester County with nearby schools including Quabbin Regional Middle School and Quabbin Regional High School.
Ownership History
Date
Name
Owned For
Owner Type
Purchase Details
Closed on
Mar 31, 2023
Sold by
Conkey Evan A and Conkey Lauren M
Bought by
Velez Diego R and Morell Amelie C
Current Estimated Value
Home Financials for this Owner
Home Financials are based on the most recent Mortgage that was taken out on this home.
Original Mortgage
$244,900
Outstanding Balance
$236,661
Interest Rate
6.32%
Mortgage Type
Purchase Money Mortgage
Estimated Equity
$133,043
Purchase Details
Closed on
Feb 29, 2016
Sold by
Conkey Evan A
Bought by
Conkey Evan A and Conkey Lauren M
Home Financials for this Owner
Home Financials are based on the most recent Mortgage that was taken out on this home.
Original Mortgage
$213,069
Interest Rate
3.92%
Mortgage Type
New Conventional
Purchase Details
Closed on
Aug 12, 2005
Sold by
Woodland Ann M and Woodland John M
Bought by
Smith Gregory C and Smith Marianne
Home Financials for this Owner
Home Financials are based on the most recent Mortgage that was taken out on this home.
Original Mortgage
$193,500
Interest Rate
5.54%
Mortgage Type
Purchase Money Mortgage
Create a Home Valuation Report for This Property
The Home Valuation Report is an in-depth analysis detailing your home's value as well as a comparison with similar homes in the area
Home Values in the Area
Average Home Value in this Area
Purchase History
| Date | Buyer | Sale Price | Title Company |
|---|---|---|---|
| Velez Diego R | $275,000 | None Available | |
| Velez Diego R | $275,000 | None Available | |
| Conkey Evan A | -- | -- | |
| Conkey Evan A | -- | -- | |
| Conkey Evan A | $217,000 | -- | |
| Conkey Evan A | $217,000 | -- | |
| Smith Gregory C | $215,000 | -- | |
| Smith Gregory C | $215,000 | -- | |
| Smith Gregory C | $215,000 | -- |
Source: Public Records
Mortgage History
| Date | Status | Borrower | Loan Amount |
|---|---|---|---|
| Open | Velez Diego R | $244,900 | |
| Closed | Velez Diego R | $244,900 | |
| Previous Owner | Conkey Evan A | $213,069 | |
| Previous Owner | Smith Gregory C | $230,500 | |
| Previous Owner | Smith Gregory C | $193,500 |
Source: Public Records
Tax History
| Year | Tax Paid | Tax Assessment Tax Assessment Total Assessment is a certain percentage of the fair market value that is determined by local assessors to be the total taxable value of land and additions on the property. | Land | Improvement |
|---|---|---|---|---|
| 2025 | $4,608 | $339,100 | $57,400 | $281,700 |
| 2024 | $4,534 | $324,300 | $54,700 | $269,600 |
| 2023 | $4,114 | $259,400 | $42,500 | $216,900 |
| 2022 | $3,996 | $237,300 | $37,300 | $200,000 |
| 2021 | $4,243 | $235,700 | $37,300 | $198,400 |
| 2020 | $4,117 | $230,400 | $37,300 | $193,100 |
| 2019 | $3,773 | $208,200 | $33,800 | $174,400 |
| 2018 | $3,880 | $206,400 | $33,800 | $172,600 |
| 2017 | $3,721 | $199,000 | $33,800 | $165,200 |
| 2016 | $3,457 | $194,200 | $30,800 | $163,400 |
| 2015 | $3,488 | $187,100 | $38,000 | $149,100 |
| 2014 | $2,994 | $186,400 | $46,500 | $139,900 |
Source: Public Records
Map
Nearby Homes
Your Personal Tour Guide
Ask me questions while you tour the home.