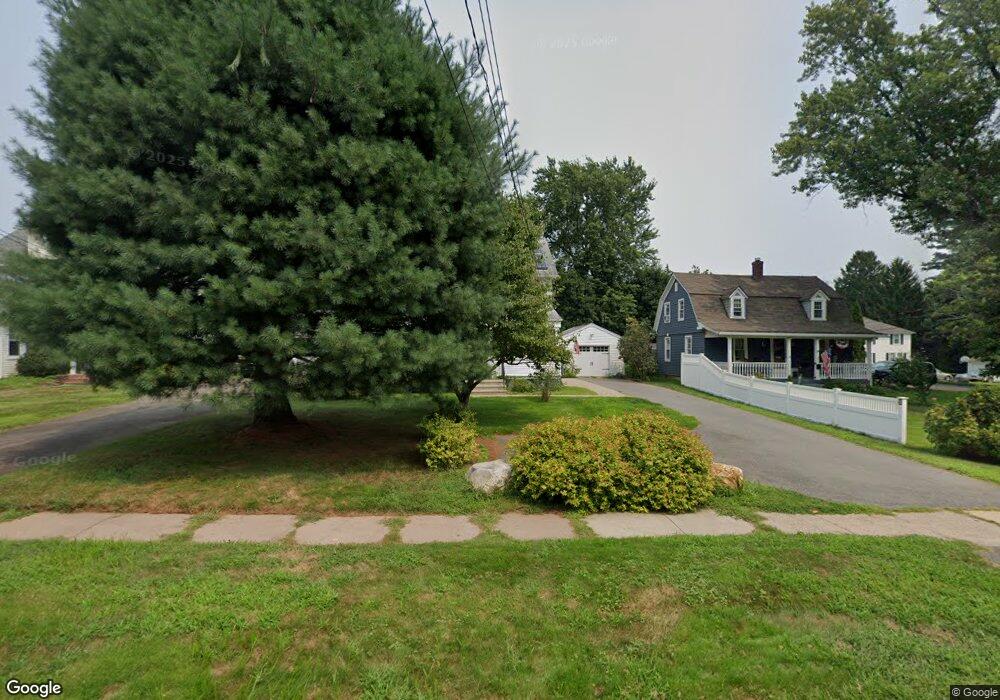
30 West St Cromwell, CT 06416
Estimated Value: $302,942 - $356,000
2
Beds
2
Baths
1,182
Sq Ft
$280/Sq Ft
Est. Value
About This Home
This home is located at 30 West St, Cromwell, CT 06416 and is currently estimated at $330,986, approximately $280 per square foot. 30 West St is a home located in Middlesex County with nearby schools including Edna C. Stevens School, Woodside Intermediate School, and Cromwell Middle School.
Ownership History
Date
Name
Owned For
Owner Type
Purchase Details
Closed on
Aug 22, 1996
Sold by
Sidorski Michael W and Sidorski Nathalie G
Bought by
Ryan Sean P and Ryan Jean M
Current Estimated Value
Home Financials for this Owner
Home Financials are based on the most recent Mortgage that was taken out on this home.
Original Mortgage
$107,100
Interest Rate
8.4%
Mortgage Type
Unknown
Create a Home Valuation Report for This Property
The Home Valuation Report is an in-depth analysis detailing your home's value as well as a comparison with similar homes in the area
Home Values in the Area
Average Home Value in this Area
Purchase History
| Date | Buyer | Sale Price | Title Company |
|---|---|---|---|
| Ryan Sean P | $105,000 | -- |
Source: Public Records
Mortgage History
| Date | Status | Borrower | Loan Amount |
|---|---|---|---|
| Closed | Ryan Sean P | $106,050 | |
| Closed | Ryan Sean P | $107,685 | |
| Closed | Ryan Sean P | $107,100 | |
| Previous Owner | Ryan Sean P | $35,000 |
Source: Public Records
Tax History
| Year | Tax Paid | Tax Assessment Tax Assessment Total Assessment is a certain percentage of the fair market value that is determined by local assessors to be the total taxable value of land and additions on the property. | Land | Improvement |
|---|---|---|---|---|
| 2025 | $4,711 | $153,020 | $59,640 | $93,380 |
| 2024 | $4,601 | $153,020 | $59,640 | $93,380 |
| 2023 | $4,500 | $153,020 | $59,640 | $93,380 |
| 2022 | $3,957 | $118,720 | $57,050 | $61,670 |
| 2021 | $3,957 | $118,720 | $57,050 | $61,670 |
| 2020 | $3,898 | $118,720 | $57,050 | $61,670 |
| 2019 | $3,898 | $118,720 | $57,050 | $61,670 |
| 2018 | $3,898 | $118,720 | $57,050 | $61,670 |
| 2017 | $3,831 | $112,920 | $49,220 | $63,700 |
| 2016 | $3,797 | $112,920 | $49,220 | $63,700 |
| 2015 | $3,543 | $112,920 | $49,220 | $63,700 |
| 2014 | $3,758 | $112,920 | $49,220 | $63,700 |
Source: Public Records
Map
Nearby Homes
- 7 Olson Ave
- 291 Main St
- 32 Lincoln Rd
- 28 & 33 River Rd
- 63 Timber Hill Rd
- 15 Oxford Ln
- 23 Crest Dr
- 5 Coe Ave
- 11 Edgewood Rd
- 548 Main St
- 12 Fairview Heights
- 23 Primrose Ln
- 25 Primrose Ln
- 27 Primrose Ln
- 29 Primrose Ln
- 20 Cherokee Ct
- 1114 Cromwell Hills Dr
- 58 Blackhaw Dr
- 2113 Cromwell Hills Dr
- 234 Skyview Dr Unit 234
Your Personal Tour Guide
Ask me questions while you tour the home.