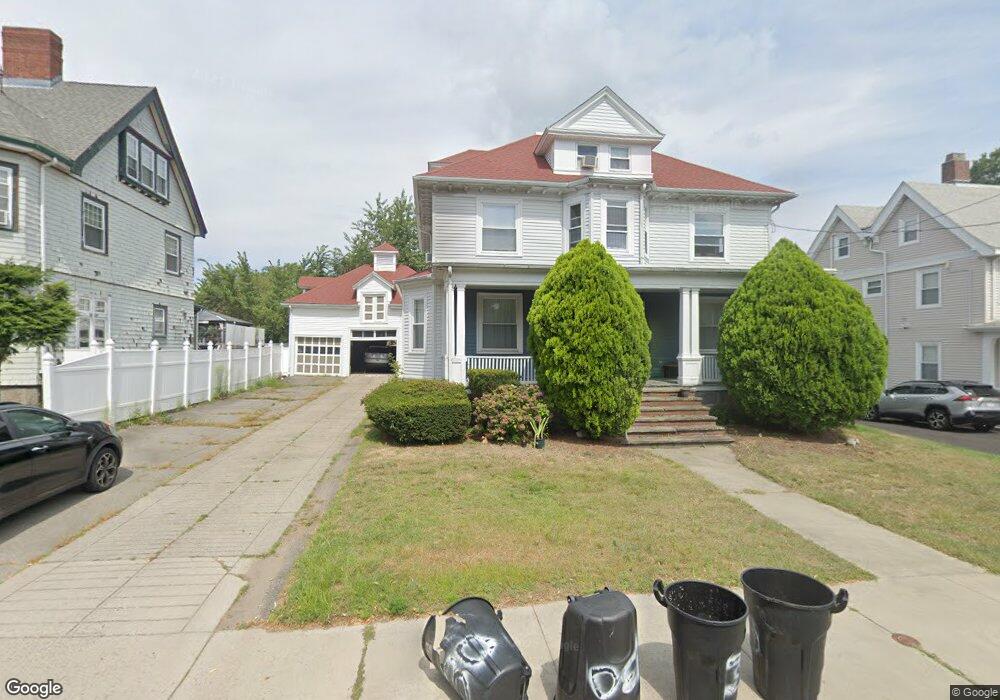
30 Whitney Rd Quincy, MA 02169
Quincy Center NeighborhoodEstimated Value: $1,111,281 - $1,187,000
7
Beds
3
Baths
3,055
Sq Ft
$375/Sq Ft
Est. Value
About This Home
This home is located at 30 Whitney Rd, Quincy, MA 02169 and is currently estimated at $1,145,070, approximately $374 per square foot. 30 Whitney Rd is a home located in Norfolk County with nearby schools including Merrymount Elementary School, Central Middle School, and Quincy High School.
Ownership History
Date
Name
Owned For
Owner Type
Purchase Details
Closed on
Sep 5, 2024
Sold by
Su Yuhua and Su Xiaoqing
Bought by
Su Yuhua
Current Estimated Value
Purchase Details
Closed on
Aug 19, 2015
Sold by
Su Yuhua
Bought by
Su Yuhua and Su Xiaoqing
Purchase Details
Closed on
May 26, 2010
Sold by
Cheah Suan L and Cheah Ewe S
Bought by
Su Yuhua
Home Financials for this Owner
Home Financials are based on the most recent Mortgage that was taken out on this home.
Original Mortgage
$400,000
Interest Rate
5.13%
Mortgage Type
Purchase Money Mortgage
Purchase Details
Closed on
Jul 27, 2001
Sold by
Diegel James T and Diegel Julie D
Bought by
Cheah Suan L and Cheah Ewe S
Home Financials for this Owner
Home Financials are based on the most recent Mortgage that was taken out on this home.
Original Mortgage
$351,000
Interest Rate
7.18%
Mortgage Type
Purchase Money Mortgage
Purchase Details
Closed on
Nov 2, 2000
Sold by
Kelly Janice and Kelly William R
Bought by
Diegel James T and Diegel Julie D
Purchase Details
Closed on
Dec 1, 1993
Sold by
Kaiser Stanley C and Kaiser Ethel M
Bought by
Kelly Janice
Create a Home Valuation Report for This Property
The Home Valuation Report is an in-depth analysis detailing your home's value as well as a comparison with similar homes in the area
Home Values in the Area
Average Home Value in this Area
Purchase History
| Date | Buyer | Sale Price | Title Company |
|---|---|---|---|
| Su Yuhua | -- | None Available | |
| Su Yuhua | -- | None Available | |
| Su Yuhua | -- | -- | |
| Su Yuhua | -- | -- | |
| Su Yuhua | $500,000 | -- | |
| Su Yuhua | $500,000 | -- | |
| Cheah Suan L | $446,000 | -- | |
| Diegel James T | $380,000 | -- | |
| Kelly Janice | $195,000 | -- | |
| Kelly Janice | $195,000 | -- |
Source: Public Records
Mortgage History
| Date | Status | Borrower | Loan Amount |
|---|---|---|---|
| Previous Owner | Kelly Janice | $394,000 | |
| Previous Owner | Su Yuhua | $400,000 | |
| Previous Owner | Kelly Janice | $351,000 |
Source: Public Records
Tax History Compared to Growth
Tax History
| Year | Tax Paid | Tax Assessment Tax Assessment Total Assessment is a certain percentage of the fair market value that is determined by local assessors to be the total taxable value of land and additions on the property. | Land | Improvement |
|---|---|---|---|---|
| 2025 | $11,890 | $1,031,200 | $291,900 | $739,300 |
| 2024 | $11,167 | $990,900 | $278,000 | $712,900 |
| 2023 | $10,747 | $965,600 | $252,700 | $712,900 |
| 2022 | $11,189 | $934,000 | $229,700 | $704,300 |
| 2021 | $10,076 | $830,000 | $229,700 | $600,300 |
| 2020 | $10,046 | $808,200 | $218,800 | $589,400 |
| 2019 | $9,385 | $747,800 | $206,400 | $541,400 |
| 2018 | $9,716 | $728,300 | $206,400 | $521,900 |
| 2017 | $8,944 | $631,200 | $196,600 | $434,600 |
| 2016 | $8,060 | $561,300 | $187,200 | $374,100 |
| 2015 | $8,156 | $558,600 | $187,200 | $371,400 |
| 2014 | $7,051 | $474,500 | $178,300 | $296,200 |
Source: Public Records
Map
Nearby Homes
- 20 Whitney Rd
- 20 Whitney Rd Unit 307
- 20 Whitney Rd Unit 101
- 40 Greenleaf St Unit 102
- 1 Adams St Unit 502
- 1025 Hancock St Unit 12K
- 1025 Hancock St Unit 1F
- 1025 Hancock St Unit 1K
- 54 Hudson St
- 95 Monroe Rd Unit 2L
- 179 Presidents Ln Unit 4I
- 195 Thomas Burgin Pkwy Unit 205
- 14 Samoset Ave
- 33 Samoset Ave
- 9 Glynn Terrace
- 29 Oval Rd
- 105 Sea St
- 77 Samoset Ave
- 2 Cliveden St Unit 601E
- 36 Bigelow St
- 30 Whitney Rd Unit B
- 24 Whitney Rd
- 32 Gilson Rd
- 32 Gilson Rd Unit 4
- 32 Gilson Rd Unit 1
- 28 Gilson Rd
- 36 Whitney Rd
- 30 Gilson Rd
- 5 Linden Ct
- 9 Linden Ct
- 42 Whitney Rd
- 13 Linden Ct
- 18 Johnson Ave
- 18 Johnson Ave
- 18 Johnson Ave Unit 18
- 18 Johnson Ave Unit 8
- 18 Johnson Ave Unit 16
- 18 Johnson Ave Unit 12
- 18 Johnson Ave Unit 5
- 18 Johnson Ave Unit 3