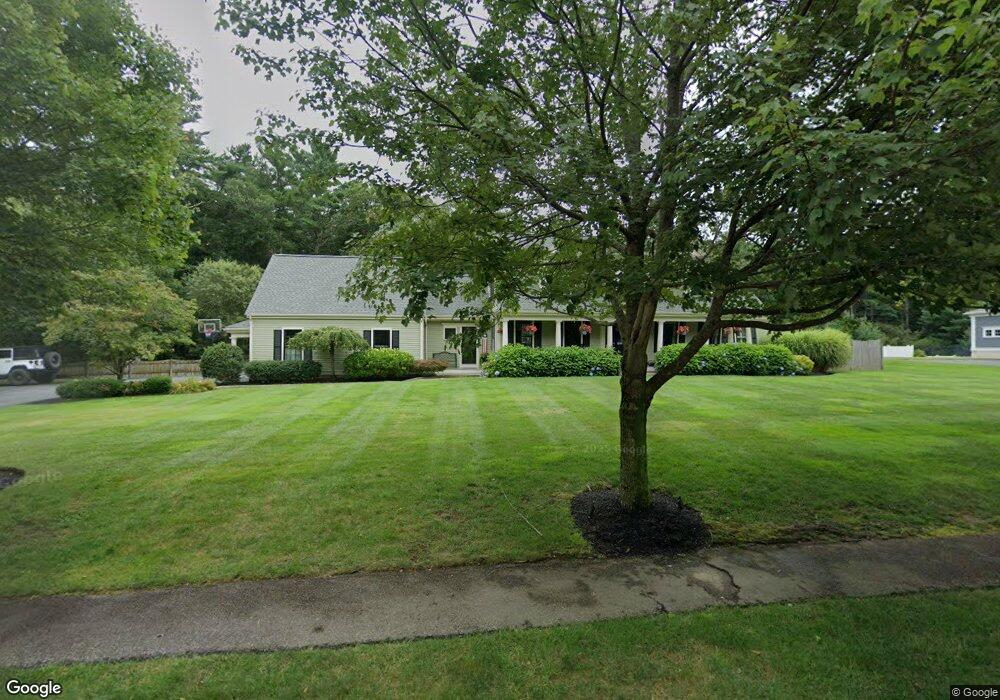
30 Windward Ln Hanover, MA 02339
Estimated Value: $1,297,547 - $1,709,000
3
Beds
3
Baths
3,581
Sq Ft
$395/Sq Ft
Est. Value
About This Home
This home is located at 30 Windward Ln, Hanover, MA 02339 and is currently estimated at $1,414,137, approximately $394 per square foot. 30 Windward Ln is a home located in Plymouth County with nearby schools including Hanover High School, South Shore Charter Public School, and Norwell KinderCare.
Ownership History
Date
Name
Owned For
Owner Type
Purchase Details
Closed on
Oct 22, 2025
Sold by
Milligan James M and Milligan Erica J
Bought by
Milligan Ft and Milligan
Current Estimated Value
Purchase Details
Closed on
Aug 3, 2007
Sold by
Windward Lane Rt and Beal
Bought by
Milligan James M and Milligan Erica J
Purchase Details
Closed on
Dec 2, 2005
Sold by
Simmons Thomas A and Hatch Janet S
Bought by
Casa Dev Inc
Purchase Details
Closed on
Jun 18, 2002
Sold by
Bloom Bertha J Est and Simmons
Bought by
Casa Dev Inc
Purchase Details
Closed on
Aug 5, 1997
Sold by
Manzella and Manzella Francis
Bought by
Casa Devel Inc
Purchase Details
Closed on
Oct 27, 1995
Sold by
Jeffrey Susan S
Bought by
Casa Dev Inc
Create a Home Valuation Report for This Property
The Home Valuation Report is an in-depth analysis detailing your home's value as well as a comparison with similar homes in the area
Home Values in the Area
Average Home Value in this Area
Purchase History
| Date | Buyer | Sale Price | Title Company |
|---|---|---|---|
| Milligan Ft | -- | -- | |
| Milligan James M | $300,000 | -- | |
| Milligan James M | $300,000 | -- | |
| Casa Dev Inc | $530,000 | -- | |
| Casa Dev Inc | $350,000 | -- | |
| Casa Dev Inc | $350,000 | -- | |
| Casa Devel Inc | $142,500 | -- | |
| Casa Dev Inc | $25,500 | -- |
Source: Public Records
Mortgage History
| Date | Status | Borrower | Loan Amount |
|---|---|---|---|
| Previous Owner | Casa Dev Inc | $523,750 | |
| Previous Owner | Casa Dev Inc | $136,000 |
Source: Public Records
Tax History Compared to Growth
Tax History
| Year | Tax Paid | Tax Assessment Tax Assessment Total Assessment is a certain percentage of the fair market value that is determined by local assessors to be the total taxable value of land and additions on the property. | Land | Improvement |
|---|---|---|---|---|
| 2025 | $15,551 | $1,259,200 | $340,700 | $918,500 |
| 2024 | $14,864 | $1,157,600 | $340,700 | $816,900 |
| 2023 | $15,290 | $1,133,400 | $309,600 | $823,800 |
| 2022 | $14,286 | $936,800 | $272,500 | $664,300 |
| 2021 | $14,597 | $893,900 | $248,200 | $645,700 |
| 2020 | $14,764 | $905,200 | $270,800 | $634,400 |
| 2019 | $13,643 | $831,400 | $282,000 | $549,400 |
| 2018 | $13,683 | $840,500 | $302,400 | $538,100 |
| 2017 | $12,535 | $758,800 | $276,800 | $482,000 |
| 2016 | $12,561 | $745,000 | $251,500 | $493,500 |
| 2015 | $11,662 | $722,100 | $251,500 | $470,600 |
Source: Public Records
Map
Nearby Homes
- 53 Chestnut St
- 276 Woodland Dr
- 70 Dillingham Way
- 118 Bates Way
- 62 Larchmont Ln
- 375 Webster St
- 265 Silver St
- 1239 Main St
- 7 Assinippi Ave Unit 306
- 8 Old Farm Rd
- 116 Spring Meadow Ln
- 114 Main St
- 14 Longwood Ln Unit 14
- 216 Whiting St
- 80 Coolidge Rd
- 250 Center St
- 51 Cervelli Farm Dr
- 37 Dr
- 23 Cervelli Farm Dr
- 38 Cervelli Farm Dr
- 48 Windward Ln
- 381 Old Town Way
- 361 Old Town Way
- 37 Windward Ln
- 60 Windward Ln
- 391 Old Town Way
- 388 Old Town Way
- 61 Windward Ln
- 51 Windward Ln
- 351 Old Town Way
- 364 Old Town Way
- 63 Windward Ln
- 72 Windward Ln
- 350 Old Town Way
- 404 Old Town Way
- 339 Old Town Way
- 75 Windward Ln
- 432 Old Town Way
- 405 Old Town Way
- 82 Buttercup Ln