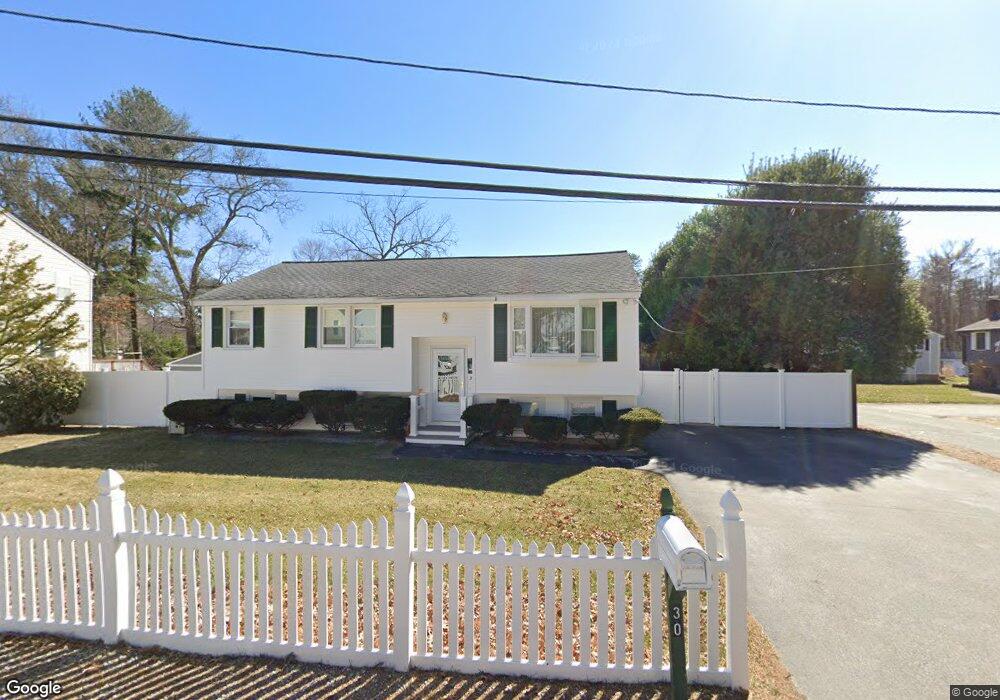
30 Wolcott St Tewksbury, MA 01876
Estimated Value: $585,662 - $626,000
3
Beds
2
Baths
1,028
Sq Ft
$592/Sq Ft
Est. Value
About This Home
This home is located at 30 Wolcott St, Tewksbury, MA 01876 and is currently estimated at $608,916, approximately $592 per square foot. 30 Wolcott St is a home located in Middlesex County with nearby schools including Heath-Brook Elementary School and Abundant Life Christian School and Childcare.
Ownership History
Date
Name
Owned For
Owner Type
Purchase Details
Closed on
May 16, 2017
Sold by
Defeo Richard W and Defeo Mary A
Bought by
Defeo 2017 T
Current Estimated Value
Purchase Details
Closed on
Nov 23, 2015
Sold by
Defeo Ft and Defeo Richard W
Bought by
Scholl Laura A and Defeo Richard J
Purchase Details
Closed on
Jun 2, 2015
Sold by
Defeo Richard W and Defeo Mary
Bought by
Defeo Ft and Defeo Richard W
Purchase Details
Closed on
Jan 17, 1972
Bought by
Defeo Richard W and Defeo Mary A
Create a Home Valuation Report for This Property
The Home Valuation Report is an in-depth analysis detailing your home's value as well as a comparison with similar homes in the area
Home Values in the Area
Average Home Value in this Area
Purchase History
| Date | Buyer | Sale Price | Title Company |
|---|---|---|---|
| Defeo 2017 T | -- | -- | |
| Scholl Laura A | -- | -- | |
| Defeo Ft | -- | -- | |
| Defeo Richard W | $26,900 | -- |
Source: Public Records
Tax History Compared to Growth
Tax History
| Year | Tax Paid | Tax Assessment Tax Assessment Total Assessment is a certain percentage of the fair market value that is determined by local assessors to be the total taxable value of land and additions on the property. | Land | Improvement |
|---|---|---|---|---|
| 2025 | $6,696 | $506,500 | $257,400 | $249,100 |
| 2024 | $6,280 | $469,000 | $245,000 | $224,000 |
| 2023 | $6,098 | $432,500 | $222,900 | $209,600 |
| 2022 | $5,744 | $377,900 | $193,700 | $184,200 |
| 2021 | $5,312 | $337,900 | $166,800 | $171,100 |
| 2020 | $5,216 | $326,600 | $159,000 | $167,600 |
| 2019 | $4,742 | $299,400 | $151,400 | $148,000 |
| 2018 | $4,460 | $276,500 | $151,400 | $125,100 |
| 2017 | $4,270 | $261,800 | $151,400 | $110,400 |
| 2016 | $4,220 | $258,100 | $150,600 | $107,500 |
| 2015 | $4,233 | $258,600 | $157,300 | $101,300 |
| 2014 | $4,015 | $249,200 | $157,300 | $91,900 |
Source: Public Records
Map
Nearby Homes