Estimated Value: $235,000 - $273,000
--
Bed
--
Bath
1,360
Sq Ft
$187/Sq Ft
Est. Value
About This Home
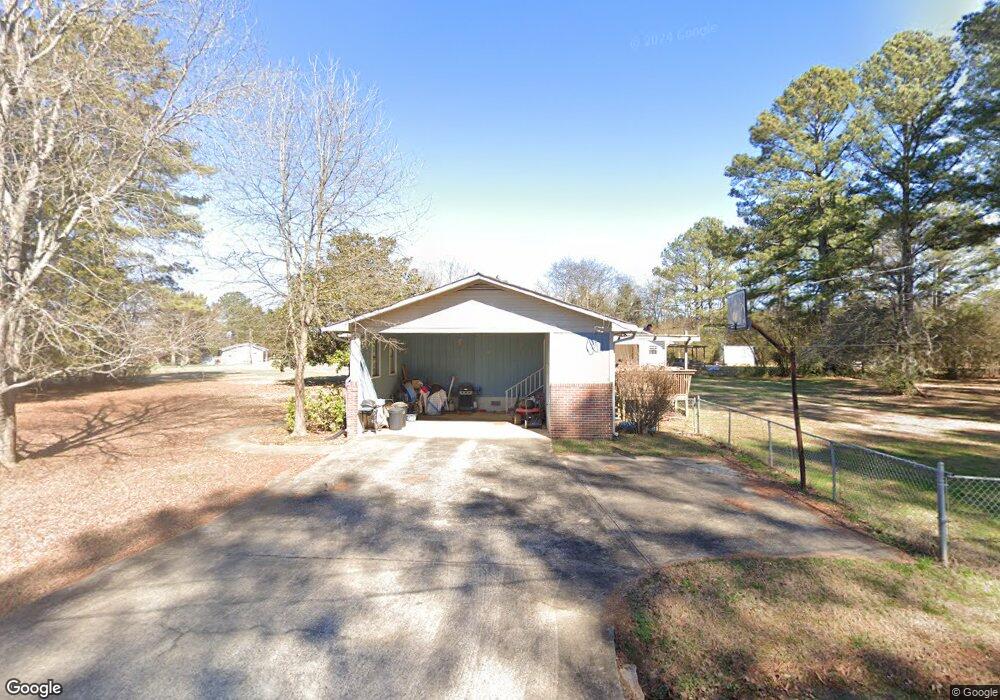
This home is located at 30 Woodcliffe Dr NE, Rome, GA 30161 and is currently estimated at $254,550, approximately $187 per square foot. 30 Woodcliffe Dr NE is a home located in Floyd County with nearby schools including Model Middle School, Model High School, and Unity Christian School.
Ownership History
Date
Name
Owned For
Owner Type
Purchase Details
Closed on
Apr 5, 2006
Sold by
Not Provided
Bought by
Hinkley Tina D
Current Estimated Value
Home Financials for this Owner
Home Financials are based on the most recent Mortgage that was taken out on this home.
Original Mortgage
$2,678
Interest Rate
6.29%
Mortgage Type
New Conventional
Purchase Details
Closed on
Jun 7, 2005
Sold by
Washington Mutual Bank
Bought by
Sec Of Housing & Urban
Purchase Details
Closed on
Oct 4, 2004
Sold by
Lowery Jeffrey and Angelia Lowery
Bought by
Lowery Angelia
Purchase Details
Closed on
Jul 3, 2003
Sold by
O'Connell Jerome and O'Connell Melba R
Bought by
Lowery Jeffrey and Angelia Lowery
Purchase Details
Closed on
Oct 19, 1998
Bought by
P and R
Purchase Details
Closed on
Jun 30, 1998
Sold by
Drake Johnny and Drake Lori M
Bought by
O'Connell Jerome and O'Connel Melba R
Purchase Details
Closed on
May 28, 1987
Sold by
Davis Jimmy L
Bought by
Drake Johnny and Drake Lori M
Purchase Details
Closed on
Dec 8, 1980
Sold by
Mcbrayer W A
Bought by
Davis Jimmy L
Purchase Details
Closed on
Jul 9, 1963
Bought by
Mcbrayer W A
Create a Home Valuation Report for This Property
The Home Valuation Report is an in-depth analysis detailing your home's value as well as a comparison with similar homes in the area
Home Values in the Area
Average Home Value in this Area
Purchase History
| Date | Buyer | Sale Price | Title Company |
|---|---|---|---|
| Hinkley Tina D | -- | -- | |
| Sec Of Housing & Urban | $106,801 | -- | |
| Washington Mutual Bank | $106,801 | -- | |
| Lowery Angelia | -- | -- | |
| Lowery Jeffrey | $104,500 | -- | |
| P | -- | -- | |
| O'Connell Jerome | $80,000 | -- | |
| Drake Johnny | $4,000 | -- | |
| Davis Jimmy L | $3,500 | -- | |
| Mcbrayer W A | $1,000 | -- |
Source: Public Records
Mortgage History
| Date | Status | Borrower | Loan Amount |
|---|---|---|---|
| Closed | Hinkley Tina D | $2,678 | |
| Open | Hinkley Tina D | $86,572 |
Source: Public Records
Tax History Compared to Growth
Tax History
| Year | Tax Paid | Tax Assessment Tax Assessment Total Assessment is a certain percentage of the fair market value that is determined by local assessors to be the total taxable value of land and additions on the property. | Land | Improvement |
|---|---|---|---|---|
| 2024 | $2,044 | $92,871 | $14,541 | $78,330 |
| 2023 | $1,932 | $84,206 | $13,036 | $71,170 |
| 2022 | $1,665 | $66,353 | $10,530 | $55,823 |
| 2021 | $1,603 | $61,396 | $10,530 | $50,866 |
| 2020 | $1,530 | $56,776 | $8,022 | $48,754 |
| 2019 | $1,348 | $48,040 | $8,022 | $40,018 |
| 2018 | $1,290 | $46,054 | $8,022 | $38,032 |
| 2017 | $1,220 | $43,656 | $8,022 | $35,634 |
| 2016 | $1,216 | $43,040 | $8,000 | $35,040 |
| 2015 | $1,170 | $42,325 | $8,000 | $34,325 |
| 2014 | $1,170 | $42,325 | $8,000 | $34,325 |
Source: Public Records
Map
Nearby Homes
- 21 Fernwood Way NE
- 3 NE Page Dr
- 107 Whispering Pines NE
- 105 Whispering Pines NE
- 3349 Calhoun Rd NE
- 163 Sweet Water Ln SE
- 165 Sweet Water Ln SE
- 253 Bells Ferry Rd NE
- 16 Maycroft Ct
- 13 Maycroft Ct
- 637 Wayside Rd NE
- 489 Barron Rd NE
- 608 Wayside Rd NE
- 1644 Wayside Rd NE
- 1654 A Ward Mountain Rd NE
- 1654 A Ward Mountain Rd NE Unit A
- 424 Wayside Rd NE
- 0 Calhoun Rd NE Unit 7516251
- 0 Calhoun Rd NE Unit 10488821
- 153 Yale Rd NE
- 0 Whispering Pines Rd Lot - 107 Unit 7423894
- 0 Whispering Pines Rd Lot - 106 Unit 7423887
- 0 Whispering Pines Rd Lot -105 Unit 7423877
- 0 Whispering Pines Rd Lot - 107 Unit 10341652
- 0 Whispering Pines Rd Lot - 106 Unit 10341647
- 0 Whispering Pines Rd Lot -105 Unit 10341631
- 2 Whispering Pines Rd NE
- 28 Woodcliffe Dr NE
- 1 Whispering Pines Rd NE
- 34 Woodcliffe Dr NE
- 3 Whispering Pines Rd NE
- 3 Whispering Pines Rd NE Unit 88-89
- 31 Woodcliffe Dr NE
- 29 Woodcliffe Dr NE
- 27 Woodcliffe Dr NE
- 27 Woodcliffe Dr NE
- 36 Woodcliffe Dr NE
- 22 Fernwood Way NE
- 33 Woodcliffe Dr NE
- 26 Woodcliffe Dr NE