300 7th St Coronado, CA 92118
Estimated Value: $3,330,000 - $5,148,482
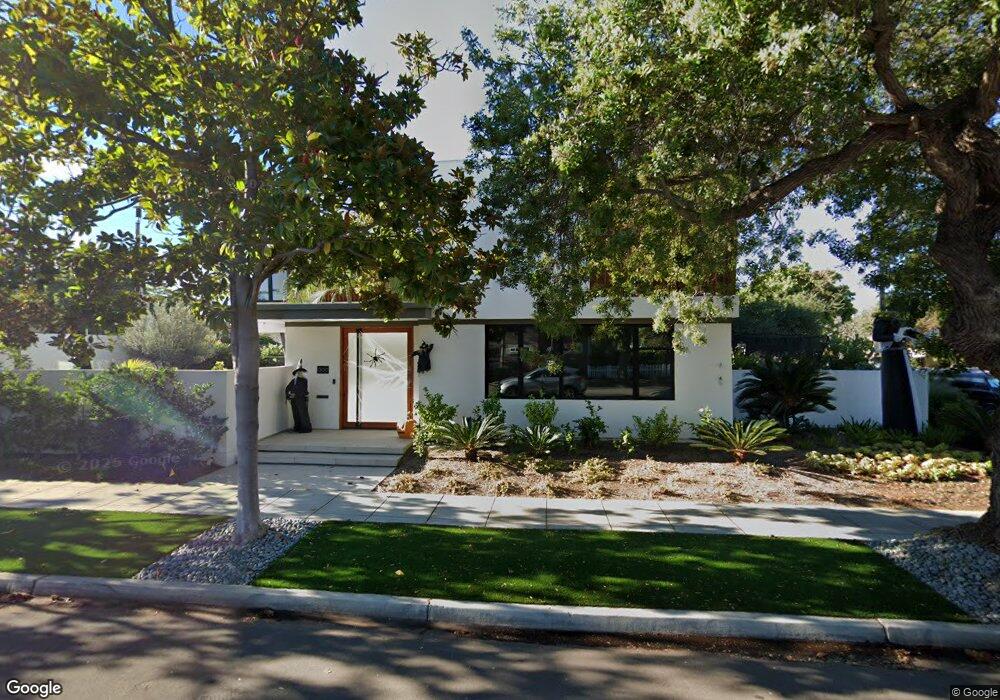
About This Home
This home is located at 300 7th St, Coronado, CA 92118 and is currently estimated at $4,291,121, approximately $2,325 per square foot. 300 7th St is a home located in San Diego County with nearby schools including Coronado Village Elementary, Coronado Middle School, and Coronado High School.
Ownership History
We collect this data history from publicly available records. To have your information removed, we recommend requesting removal directly through your county’s website.
Purchase Details
Purchase Details
Home Financials for this Owner
Home Financials are based on the most recent Mortgage that was taken out on this home.Purchase Details
Home Financials for this Owner
Home Financials are based on the most recent Mortgage that was taken out on this home.Home Values in the Area
Average Home Value in this Area
Purchase History
We collect this data history from publicly available records. To have your information removed, we recommend requesting removal directly through your county’s website.
| Date | Buyer | Sale Price | Title Company |
|---|---|---|---|
| $775,000 | First American Title | ||
| $450,000 | California Title Company | ||
| $1,525,000 | Lawyers Title |
Mortgage History
We collect this data history from publicly available records. To have your information removed, we recommend requesting removal directly through your county’s website.
| Date | Status | Borrower | Loan Amount |
|---|---|---|---|
| Previous Owner | $725,000 | ||
| Previous Owner | $650,000 |
Tax History
We collect this data history from publicly available records. To have your information removed, we recommend requesting removal directly through your county’s website.
| Year | Tax Paid | Tax Assessment Tax Assessment Total Assessment is a certain percentage of the fair market value that is determined by local assessors to be the total taxable value of land and additions on the property. | Land | Improvement |
|---|---|---|---|---|
| 2025 | $27,053 | $2,575,268 | $1,740,560 | $834,708 |
| 2024 | $27,053 | $2,524,774 | $1,706,432 | $818,342 |
| 2023 | $26,617 | $2,475,270 | $1,672,973 | $802,297 |
| 2022 | $26,107 | $2,426,736 | $1,640,170 | $786,566 |
| 2021 | $25,716 | $2,379,154 | $1,608,010 | $771,144 |
| 2020 | $24,988 | $2,354,759 | $1,591,522 | $763,237 |
| 2019 | $24,902 | $2,308,588 | $1,560,316 | $748,272 |
| 2018 | $24,472 | $2,263,322 | $1,529,722 | $733,600 |
| 2017 | $20 | $1,675,515 | $1,499,728 | $175,787 |
| 2016 | $17,716 | $1,642,663 | $1,470,322 | $172,341 |
| 2015 | $17,436 | $1,617,990 | $1,448,237 | $169,753 |
| 2014 | $17,016 | $1,586,297 | $1,419,869 | $166,428 |
Map
- 650 Alameda Blvd
- 640 Alameda Blvd
- 660 Alameda Blvd
- 630 Alameda Blvd
- 670 Alameda Blvd
- 651 Country Club Ln
- 641 Country Club Ln
- 661 Country Club Ln
- 631 Country Club Ln
- 620 Alameda Blvd
- 700 Alameda Blvd
- 671 Alameda Blvd
- 655 Alameda Blvd
- 701 Country Club Ln
- 301 7th St
- 677 Alameda Blvd
- 647 Alameda Blvd
- 621 Country Club Ln
- 641 Alameda Blvd
- 633 Alameda Blvd
Ask me questions while you tour the home.