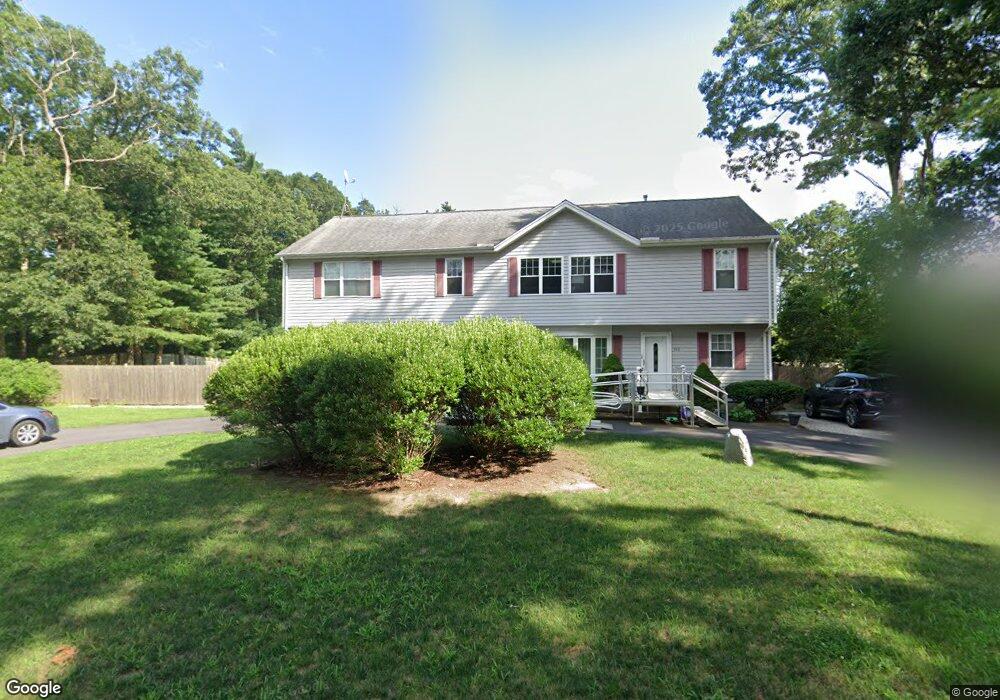
300 Briggs Rd Westport, MA 02790
North Westport NeighborhoodEstimated Value: $515,000 - $702,000
4
Beds
--
Bath
3,068
Sq Ft
$197/Sq Ft
Est. Value
About This Home
This home is located at 300 Briggs Rd, Westport, MA 02790 and is currently estimated at $605,782, approximately $197 per square foot. 300 Briggs Rd is a home located in Bristol County with nearby schools including Alice A. Macomber Primary School, Westport Elementary School, and Westport Middle-High School.
Ownership History
Date
Name
Owned For
Owner Type
Purchase Details
Closed on
Sep 1, 2016
Sold by
Vincelette Robert A and Vincelette Jean M
Bought by
Vincelette Marie J and Coelho Beth A
Current Estimated Value
Purchase Details
Closed on
Nov 22, 1967
Bought by
Vincelette Robert A and Vincelette Jean M
Create a Home Valuation Report for This Property
The Home Valuation Report is an in-depth analysis detailing your home's value as well as a comparison with similar homes in the area
Home Values in the Area
Average Home Value in this Area
Purchase History
| Date | Buyer | Sale Price | Title Company |
|---|---|---|---|
| Vincelette Marie J | -- | -- | |
| Vincelette Robert A | -- | -- |
Source: Public Records
Mortgage History
| Date | Status | Borrower | Loan Amount |
|---|---|---|---|
| Previous Owner | Vincelette Robert A | $75,000 | |
| Previous Owner | Vincelette Robert A | $70,800 | |
| Previous Owner | Vincelette Robert A | $45,000 |
Source: Public Records
Tax History Compared to Growth
Tax History
| Year | Tax Paid | Tax Assessment Tax Assessment Total Assessment is a certain percentage of the fair market value that is determined by local assessors to be the total taxable value of land and additions on the property. | Land | Improvement |
|---|---|---|---|---|
| 2025 | $3,946 | $529,600 | $173,400 | $356,200 |
| 2024 | $3,884 | $502,400 | $153,900 | $348,500 |
| 2023 | $3,867 | $473,900 | $140,200 | $333,700 |
| 2022 | $3,613 | $426,100 | $140,200 | $285,900 |
| 2021 | $3,276 | $380,000 | $115,900 | $264,100 |
| 2020 | $3,165 | $375,400 | $111,300 | $264,100 |
| 2019 | $2,964 | $358,400 | $111,300 | $247,100 |
| 2018 | $3,020 | $369,600 | $119,500 | $250,100 |
| 2017 | $2,912 | $365,400 | $119,500 | $245,900 |
| 2016 | $2,688 | $339,800 | $119,500 | $220,300 |
| 2015 | $2,627 | $331,300 | $119,500 | $211,800 |
Source: Public Records
Map
Nearby Homes