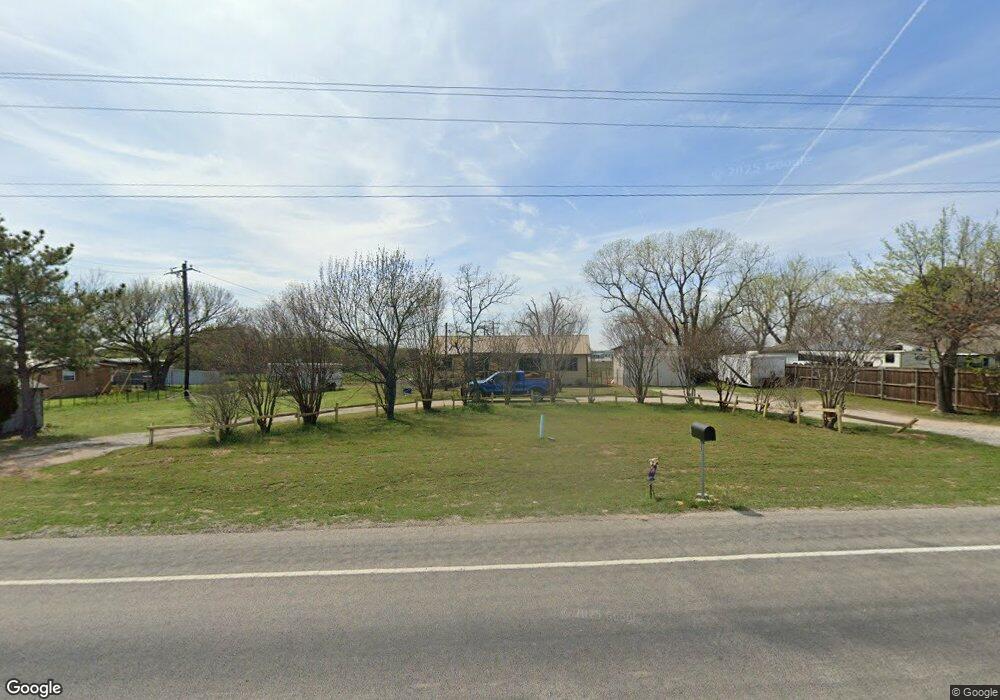
300 Brock Spur Millsap, TX 76066
Estimated Value: $335,835 - $411,000
--
Bed
--
Bath
1,512
Sq Ft
$248/Sq Ft
Est. Value
About This Home
This home is located at 300 Brock Spur, Millsap, TX 76066 and is currently estimated at $375,709, approximately $248 per square foot. 300 Brock Spur is a home located in Parker County with nearby schools including Brock Intermediate School, Brock Junior High School, and Brock High School.
Ownership History
Date
Name
Owned For
Owner Type
Purchase Details
Closed on
Aug 18, 2010
Sold by
Bluegreen Southwest One Lp
Bought by
Guyon William Keith and Guyon Kelly Caroline
Current Estimated Value
Home Financials for this Owner
Home Financials are based on the most recent Mortgage that was taken out on this home.
Original Mortgage
$17,910
Interest Rate
4.06%
Mortgage Type
Purchase Money Mortgage
Purchase Details
Closed on
Sep 12, 2008
Sold by
Rash Don King and Rash Mary Ann
Bought by
Barnett Jon M
Home Financials for this Owner
Home Financials are based on the most recent Mortgage that was taken out on this home.
Original Mortgage
$126,000
Interest Rate
6.1%
Mortgage Type
Purchase Money Mortgage
Purchase Details
Closed on
Jul 20, 2007
Sold by
Maxwell Sandra Miller
Bought by
Barnett Jon M
Purchase Details
Closed on
Jan 13, 2001
Sold by
Miller Richard and Miller Sandra
Bought by
Barnett Jon M
Purchase Details
Closed on
Sep 8, 1994
Bought by
Barnett Jon M
Purchase Details
Closed on
Jan 5, 1990
Bought by
Barnett Jon M
Create a Home Valuation Report for This Property
The Home Valuation Report is an in-depth analysis detailing your home's value as well as a comparison with similar homes in the area
Home Values in the Area
Average Home Value in this Area
Purchase History
| Date | Buyer | Sale Price | Title Company |
|---|---|---|---|
| Guyon William Keith | -- | None Available | |
| Barnett Jon M | -- | Providence Title | |
| Barnett Jon M | -- | -- | |
| Rash Don King | -- | Stnt | |
| Barnett Jon M | -- | -- | |
| Barnett Jon M | -- | -- | |
| Barnett Jon M | -- | -- |
Source: Public Records
Mortgage History
| Date | Status | Borrower | Loan Amount |
|---|---|---|---|
| Closed | Guyon William Keith | $17,910 | |
| Previous Owner | Barnett Jon M | $126,000 |
Source: Public Records
Tax History Compared to Growth
Tax History
| Year | Tax Paid | Tax Assessment Tax Assessment Total Assessment is a certain percentage of the fair market value that is determined by local assessors to be the total taxable value of land and additions on the property. | Land | Improvement |
|---|---|---|---|---|
| 2025 | $6,113 | $234,330 | $115,310 | $119,020 |
| 2024 | $6,113 | $330,450 | $105,190 | $225,260 |
| 2023 | $6,113 | $330,450 | $105,190 | $225,260 |
| 2022 | $3,302 | $162,660 | $52,590 | $110,070 |
| 2021 | $3,473 | $162,660 | $52,590 | $110,070 |
| 2020 | $2,621 | $121,080 | $31,580 | $89,500 |
| 2019 | $2,822 | $121,080 | $31,580 | $89,500 |
| 2018 | $2,662 | $113,700 | $21,100 | $92,600 |
| 2017 | $2,616 | $113,700 | $21,100 | $92,600 |
| 2016 | $2,276 | $98,930 | $16,870 | $82,060 |
| 2015 | $2,247 | $98,930 | $16,870 | $82,060 |
| 2014 | $2,170 | $94,570 | $15,830 | $78,740 |
Source: Public Records
Map
Nearby Homes
- XXXX Wolf Hollow
- 401 Brock Spur
- 7530 W Interstate 20
- 181 Savannah Dr
- 169 Savannah Dr
- TBD Wolf Hollow
- 3810 Fairview Rd
- 1700 Fm 1189
- 251 Tumbleweed Ct
- 4000 Luciano Dr
- 3036 Palermo Dr
- 102 Eagle Pass Ln
- TBD Grindstone Rd
- 2007 Verona Dr
- 2053 Verona Dr
- 2004 Verona Dr
- 734 Young Bend Rd
- 2026 Verona Dr
- 3200 Fairview Rd
- 2030 Verona Dr
- 306 Brock Spur
- 280 Brock Spur
- TBD Brock Spur
- 383 Fm 1189
- 7415 Quanah Hill Rd
- 391 Fm 1189 Unit 1189
- 387 Fm 1189
- 391 Fm 1189
- 330 Fm 1189
- 330 Fm 1189
- 330 Fm 1189
- 106 Millsap Ct
- 0 Wolf Hollow Unit 11068012
- 433 Brock Spur
- 403 Brock Spur
- 400 Fm 1189
- 7245 Quanah Hill Rd
- 7452 W Interstate 20 Service Rd
- 0 Brock Spur
- 15 Brock Spur