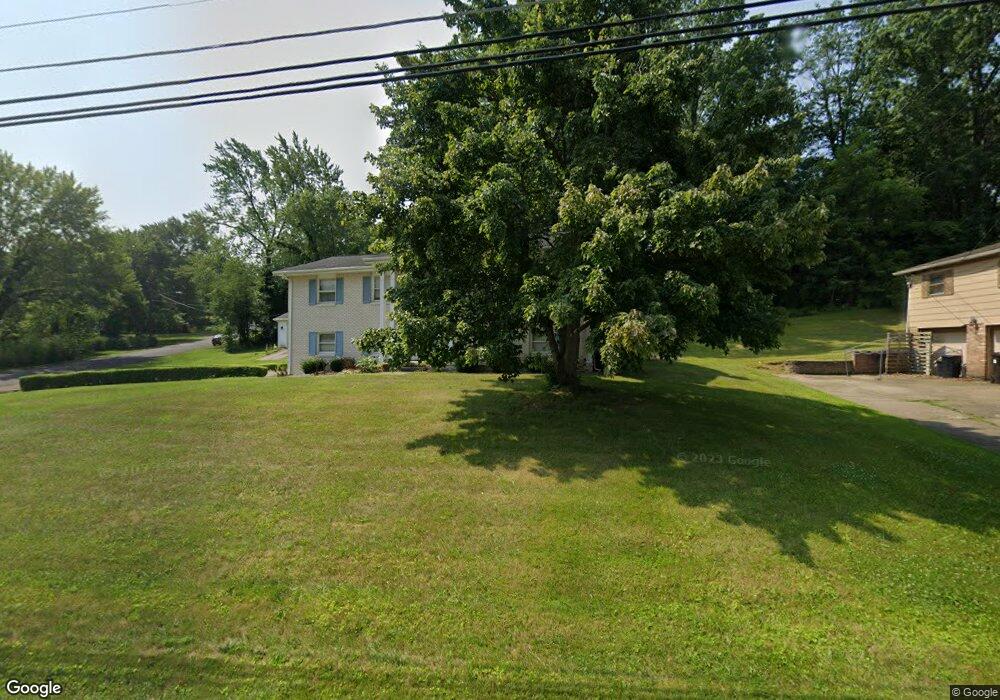
300 Carnwise St SW Canton, OH 44706
Estimated Value: $260,605 - $289,000
3
Beds
2
Baths
1,872
Sq Ft
$147/Sq Ft
Est. Value
About This Home
This home is located at 300 Carnwise St SW, Canton, OH 44706 and is currently estimated at $275,651, approximately $147 per square foot. 300 Carnwise St SW is a home located in Stark County with nearby schools including Faircrest Memorial Elementary School, Canton South High School, and Beacon Academy.
Ownership History
Date
Name
Owned For
Owner Type
Purchase Details
Closed on
Feb 16, 2015
Sold by
Ebert Paula A
Bought by
Mcmahon Donald J
Current Estimated Value
Purchase Details
Closed on
Nov 8, 2010
Sold by
Hampton Vickie L and Karcher Vickie L
Bought by
Mcmahon Donald J and Ebert Paula A
Home Financials for this Owner
Home Financials are based on the most recent Mortgage that was taken out on this home.
Original Mortgage
$100,000
Interest Rate
4.37%
Mortgage Type
New Conventional
Purchase Details
Closed on
Sep 13, 1995
Sold by
Miller Ronald E
Bought by
Hampton David D and Karcher Vicki
Home Financials for this Owner
Home Financials are based on the most recent Mortgage that was taken out on this home.
Original Mortgage
$76,000
Interest Rate
7.81%
Mortgage Type
New Conventional
Create a Home Valuation Report for This Property
The Home Valuation Report is an in-depth analysis detailing your home's value as well as a comparison with similar homes in the area
Purchase History
| Date | Buyer | Sale Price | Title Company |
|---|---|---|---|
| Mcmahon Donald J | -- | None Available | |
| Mcmahon Donald J | $125,000 | Attorney | |
| Hampton David D | $95,000 | -- |
Source: Public Records
Mortgage History
| Date | Status | Borrower | Loan Amount |
|---|---|---|---|
| Previous Owner | Mcmahon Donald J | $100,000 | |
| Previous Owner | Hampton David D | $76,000 |
Source: Public Records
Tax History
| Year | Tax Paid | Tax Assessment Tax Assessment Total Assessment is a certain percentage of the fair market value that is determined by local assessors to be the total taxable value of land and additions on the property. | Land | Improvement |
|---|---|---|---|---|
| 2025 | -- | $84,810 | $23,070 | $61,740 |
| 2024 | -- | $84,810 | $23,070 | $61,740 |
| 2023 | $2,854 | $62,060 | $17,190 | $44,870 |
| 2022 | $2,641 | $62,060 | $17,190 | $44,870 |
| 2021 | $2,650 | $62,060 | $17,190 | $44,870 |
| 2020 | $2,420 | $49,530 | $13,620 | $35,910 |
| 2019 | $2,459 | $49,540 | $13,620 | $35,920 |
| 2018 | $2,439 | $49,540 | $13,620 | $35,920 |
| 2017 | $2,463 | $47,260 | $12,570 | $34,690 |
| 2016 | $2,349 | $44,850 | $12,570 | $32,280 |
| 2015 | $2,191 | $41,800 | $12,570 | $29,230 |
| 2014 | $213 | $39,590 | $11,900 | $27,690 |
| 2013 | $1,112 | $39,590 | $11,900 | $27,690 |
Source: Public Records
Map
Nearby Homes
- 3673 Highview Ave SW
- 337 33rd St SW
- 260 Ironwood St SW
- 611 Mill St SE
- 3211 Dueber Ave SW
- 4847 Ashmont Ave SW
- 4858 Ashmont Ave SW
- 0 49th St SW Unit 5185153
- 0 49th St SW Unit 5185124
- 2103 Henry Ave SW
- 1889 Faircrest St SE
- 0 Birchmont Ave SW Unit 5185117
- 5213 Ridge Ave SE
- 5247 Birchmont Ave SW
- 600 53rd St SW
- 1721 Hammond Ave SW
- 0 20th St SW
- 1700 Clark Ave SW
- 1529 Stark Ave SW
- 5343 Cleveland Ave S
- 310 Carnwise St SW
- 236 Carnwise St SW
- 320 Carnwise St SW
- 3630 Diane Ave SW
- 3630 Diane Ave SW
- 3633 Highview Ave SW
- 400 Carnwise St SW
- 305 Carnwise St SW
- 224 Carnwise St SW
- 3640 Diane Ave SW
- 3626 Highview Ave SW
- 315 Carnwise St SW
- 245 Carnwise St SW
- 410 Carnwise St SW
- 3631 Diane Ave SW
- 325 Carnwise St SW
- 212 Carnwise St SW
- 231 Carnwise St SW
- 3650 Diane Ave SW
Your Personal Tour Guide
Ask me questions while you tour the home.