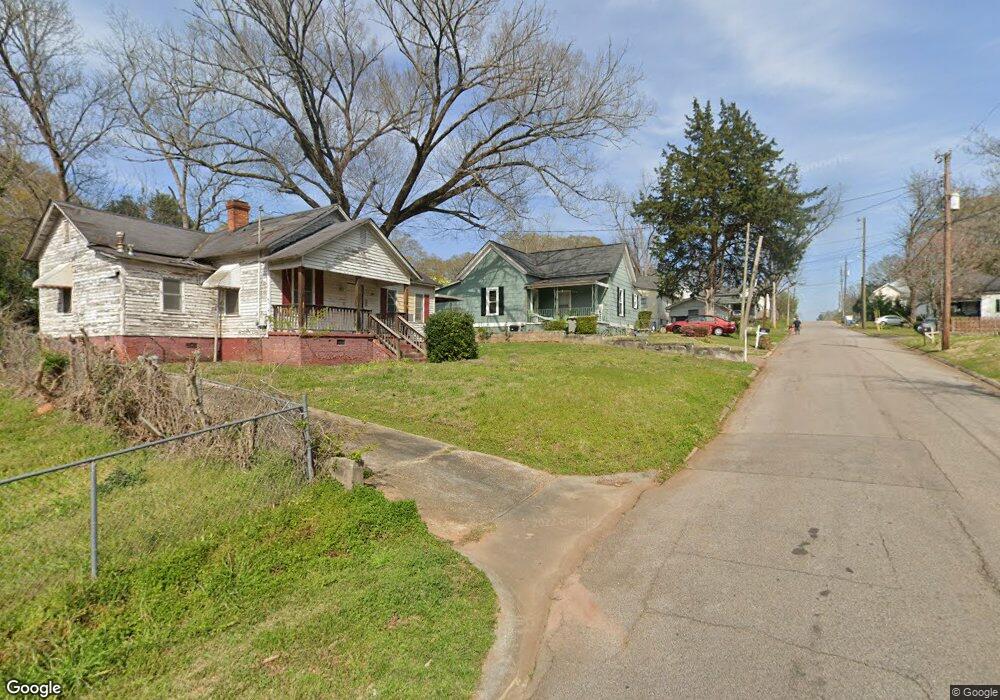
300 Cherry St Lagrange, GA 30240
Estimated Value: $119,128 - $151,000
3
Beds
2
Baths
1,436
Sq Ft
$93/Sq Ft
Est. Value
About This Home
This home is located at 300 Cherry St, Lagrange, GA 30240 and is currently estimated at $133,532, approximately $92 per square foot. 300 Cherry St is a home located in Troup County with nearby schools including Ethel W. Kight Elementary School, Hollis Hand Elementary School, and Franklin Forest Elementary School.
Ownership History
Date
Name
Owned For
Owner Type
Purchase Details
Closed on
Aug 12, 1999
Sold by
Patricia John J and Patricia Bailey
Bought by
Boyd Lum
Current Estimated Value
Purchase Details
Closed on
May 6, 1998
Sold by
Crawford Michael and Crawford Sheri
Bought by
Patricia John J and Patricia Bailey
Purchase Details
Closed on
May 5, 1998
Sold by
Wright Patricia A
Bought by
Crawford Michael and Crawford Sheri
Purchase Details
Closed on
Mar 1, 1994
Sold by
Deloach Lillian
Bought by
Wright Patricia A
Purchase Details
Closed on
May 26, 1987
Sold by
Ezra D Freeman
Bought by
Deloach Lillian
Purchase Details
Closed on
May 1, 1987
Sold by
Wendell E Freeman
Bought by
Ezra D Freeman
Purchase Details
Closed on
Mar 8, 1976
Sold by
Ison Johnson By Ex
Bought by
Ezra D Freeman
Purchase Details
Closed on
Mar 25, 1961
Sold by
Dorothy Ann Moskowitz Haskins
Bought by
Ison Johnson By Ex
Purchase Details
Closed on
Jul 7, 1959
Sold by
Dorothy Ann Moskowitz
Bought by
Dorothy Ann Moskowitz Haskins
Purchase Details
Closed on
Jul 13, 1943
Sold by
Deering T D
Bought by
Dorothy Ann Moskowitz
Create a Home Valuation Report for This Property
The Home Valuation Report is an in-depth analysis detailing your home's value as well as a comparison with similar homes in the area
Purchase History
| Date | Buyer | Sale Price | Title Company |
|---|---|---|---|
| Boyd Lum | $48,500 | -- | |
| Patricia John J | $39,000 | -- | |
| Crawford Michael | -- | -- | |
| Wright Patricia A | $36,100 | -- | |
| Deloach Lillian | $22,000 | -- | |
| Ezra D Freeman | -- | -- | |
| Wendell E Freeman | -- | -- | |
| Ezra D Freeman | -- | -- | |
| Ison Johnson By Ex | -- | -- | |
| Dorothy Ann Moskowitz Haskins | -- | -- | |
| Dorothy Ann Moskowitz | -- | -- |
Source: Public Records
Tax History
| Year | Tax Paid | Tax Assessment Tax Assessment Total Assessment is a certain percentage of the fair market value that is determined by local assessors to be the total taxable value of land and additions on the property. | Land | Improvement |
|---|---|---|---|---|
| 2025 | $865 | $36,544 | $3,000 | $33,544 |
| 2024 | $724 | $28,544 | $3,000 | $25,544 |
| 2023 | $202 | $27,304 | $3,000 | $24,304 |
| 2022 | $672 | $26,064 | $3,000 | $23,064 |
| 2021 | $538 | $19,816 | $3,000 | $16,816 |
| 2020 | $538 | $19,816 | $3,000 | $16,816 |
| 2019 | $503 | $18,652 | $3,000 | $15,652 |
| 2018 | $503 | $18,652 | $3,000 | $15,652 |
| 2017 | $503 | $18,652 | $3,000 | $15,652 |
| 2016 | $467 | $17,477 | $4,000 | $13,477 |
| 2015 | $468 | $17,477 | $4,000 | $13,477 |
| 2014 | $448 | $16,768 | $4,000 | $12,768 |
| 2013 | -- | $18,132 | $4,000 | $14,132 |
Source: Public Records
Map
Nearby Homes
- 206 Peachtree St
- 509 S Lewis St
- 505 S Lewis St
- 207 Wilkes St
- 501 Milam St
- 303 E Mulberry St
- 405 W Broome St Unit 2
- 405 W Broome St Unit 3
- 405 W Broome St Unit 4
- 405 W Broome St Unit 1
- 405 W Broome St Unit 5
- 203 Fannin St
- 205 Fannin St
- 304 Boulevard
- 416 Park Ave
- 208 Boulevard
- 600 Park Ave
- 914 Todd St
- 421 College Ave
- 206 Broad St
- 302 Cherry St
- 516 S Lewis St
- 516 S Lewis St Unit 6-7
- 304 Cherry St
- 514 S Lewis St
- 315 Cherry St
- 311 Cherry St
- 512 S Lewis St
- 313 Cherry St
- 519 S Lewis St
- 303 Cherry St
- 517 S Lewis St
- 510 S Lewis St
- 317 Cherry St
- 522 Douglas St
- 515 S Lewis St
- 602 Douglas St
- 602 Douglas St Unit 8
- 210 Peachtree St
- 214 Peachtree St
Your Personal Tour Guide
Ask me questions while you tour the home.