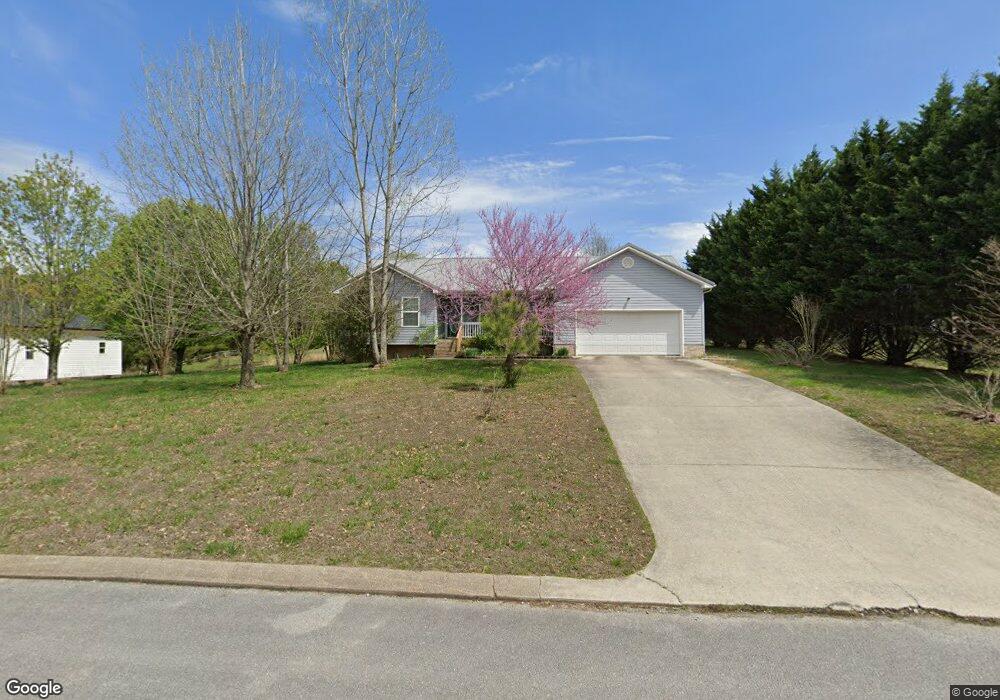
300 Chloe Dr Unit 25 La Fayette, GA 30728
Estimated Value: $263,000 - $347,000
--
Bed
2
Baths
1,424
Sq Ft
$210/Sq Ft
Est. Value
About This Home
This home is located at 300 Chloe Dr Unit 25, La Fayette, GA 30728 and is currently estimated at $298,519, approximately $209 per square foot. 300 Chloe Dr Unit 25 is a home located in Walker County with nearby schools including Naomi Elementary School, Lafayette Middle School, and Lafayette High School.
Ownership History
Date
Name
Owned For
Owner Type
Purchase Details
Closed on
Feb 7, 2006
Sold by
Vernon Edgeman
Bought by
Thornton Cynthia Kay
Current Estimated Value
Home Financials for this Owner
Home Financials are based on the most recent Mortgage that was taken out on this home.
Original Mortgage
$96,000
Outstanding Balance
$53,659
Interest Rate
6.08%
Mortgage Type
New Conventional
Estimated Equity
$244,860
Purchase Details
Closed on
Jan 11, 2005
Sold by
Not Provided
Bought by
Thornton Cythina Kay
Home Financials for this Owner
Home Financials are based on the most recent Mortgage that was taken out on this home.
Original Mortgage
$103,600
Interest Rate
5.62%
Mortgage Type
New Conventional
Purchase Details
Closed on
Jan 22, 2004
Sold by
W & B Construction Inc
Bought by
Edgeman Debra
Purchase Details
Closed on
Apr 16, 2003
Bought by
W & B Construction Inc
Create a Home Valuation Report for This Property
The Home Valuation Report is an in-depth analysis detailing your home's value as well as a comparison with similar homes in the area
Home Values in the Area
Average Home Value in this Area
Purchase History
| Date | Buyer | Sale Price | Title Company |
|---|---|---|---|
| Thornton Cynthia Kay | $120,000 | -- | |
| Thornton Cythina Kay | $120,000 | -- | |
| Thornton Cythina Kay | $20,000 | -- | |
| Edgeman Debra | $160,000 | -- | |
| W & B Construction Inc | -- | -- |
Source: Public Records
Mortgage History
| Date | Status | Borrower | Loan Amount |
|---|---|---|---|
| Open | Thornton Cythina Kay | $96,000 | |
| Closed | Thornton Cythina Kay | $96,000 | |
| Previous Owner | Thornton Cythina Kay | $103,600 |
Source: Public Records
Tax History Compared to Growth
Tax History
| Year | Tax Paid | Tax Assessment Tax Assessment Total Assessment is a certain percentage of the fair market value that is determined by local assessors to be the total taxable value of land and additions on the property. | Land | Improvement |
|---|---|---|---|---|
| 2024 | $2,282 | $104,562 | $10,000 | $94,562 |
| 2023 | $2,226 | $99,824 | $10,000 | $89,824 |
| 2022 | $2,046 | $83,964 | $6,000 | $77,964 |
| 2021 | $1,683 | $61,936 | $6,000 | $55,936 |
| 2020 | $1,449 | $50,961 | $6,000 | $44,961 |
| 2019 | $1,475 | $50,961 | $6,000 | $44,961 |
| 2018 | $1,348 | $50,961 | $6,000 | $44,961 |
| 2017 | $1,616 | $50,961 | $6,000 | $44,961 |
| 2016 | $1,328 | $50,961 | $6,000 | $44,961 |
| 2015 | $1,410 | $51,164 | $6,000 | $45,164 |
| 2014 | $1,305 | $51,164 | $6,000 | $45,164 |
| 2013 | -- | $51,163 | $6,000 | $45,163 |
Source: Public Records
Map
Nearby Homes
- 57 McGaha Rd
- 0 Georgia 95
- 106 Meadow Oak Dr
- 58 Oak Run
- 1314 Mcintire Rd
- 23 Oak Meadow Dr
- 450 Arnold Ln
- 5062 Georgia 95
- 218 Golden Oaks Dr
- 1934 Round Pond Rd
- 1052 Huffman Rd
- 0 Clyde Byrd Rd
- 7606 Highway 95
- 533 Van Dell Dr
- 1585 E Reed Rd
- 201 Van Dell Dr
- 34 Winter Ln
- 1186 E Reed Rd
- 0 Tarvin Rd Unit 1523862
- 1547 Dunwoody Rd