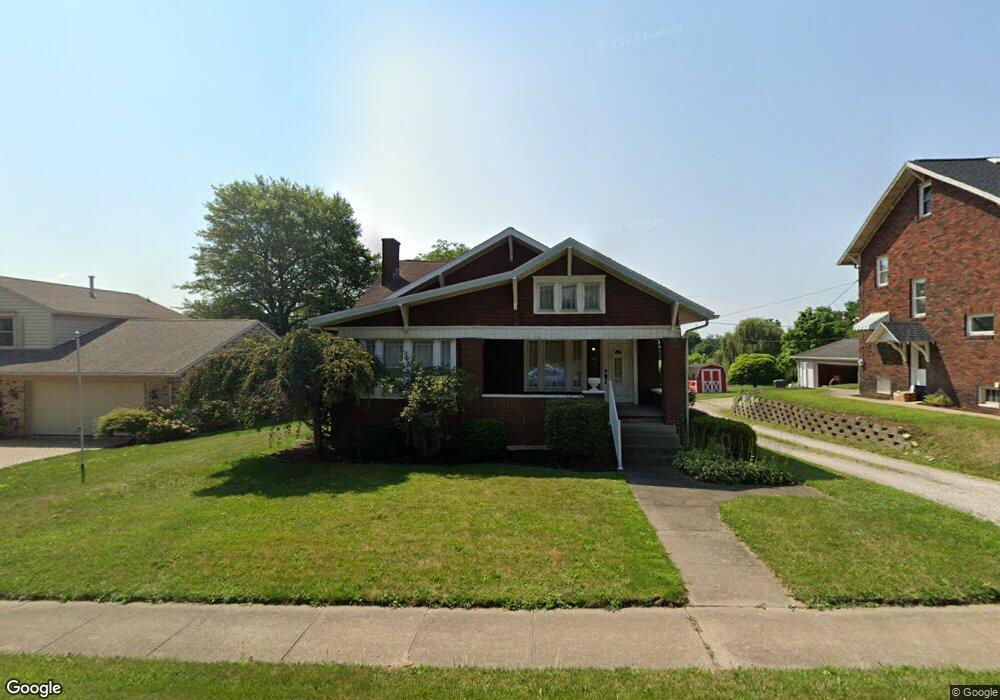
300 Dover Rd NE Sugarcreek, OH 44681
Estimated Value: $203,000 - $222,000
4
Beds
2
Baths
1,366
Sq Ft
$157/Sq Ft
Est. Value
About This Home
This home is located at 300 Dover Rd NE, Sugarcreek, OH 44681 and is currently estimated at $214,513, approximately $157 per square foot. 300 Dover Rd NE is a home located in Tuscarawas County with nearby schools including Garaway High School, Genza Bottom, and OAK RIDGE SCHOOL.
Ownership History
Date
Name
Owned For
Owner Type
Purchase Details
Closed on
Jun 30, 2016
Sold by
Lorah David P
Bought by
Miller Sally S
Current Estimated Value
Purchase Details
Closed on
Jan 18, 2002
Sold by
Barnhouse Brock D
Bought by
Lorah David P
Home Financials for this Owner
Home Financials are based on the most recent Mortgage that was taken out on this home.
Original Mortgage
$71,000
Interest Rate
6.92%
Mortgage Type
New Conventional
Purchase Details
Closed on
Feb 15, 1999
Sold by
Wilson Mary G and Griggs Mary Wilson
Bought by
Barnhouse Brock D and Barnhouse Stephanie M
Home Financials for this Owner
Home Financials are based on the most recent Mortgage that was taken out on this home.
Original Mortgage
$81,700
Interest Rate
6.88%
Purchase Details
Closed on
Nov 23, 1992
Sold by
Wilson Lowell O and Wilson Mary G
Bought by
Wilson Family Revocable Living and Miller Sally S
Purchase Details
Closed on
Dec 30, 1987
Sold by
Schlabach Delon E and Schlabach Sharon K
Bought by
Wilson Lowell O and Wilson Mary G
Create a Home Valuation Report for This Property
The Home Valuation Report is an in-depth analysis detailing your home's value as well as a comparison with similar homes in the area
Home Values in the Area
Average Home Value in this Area
Purchase History
| Date | Buyer | Sale Price | Title Company |
|---|---|---|---|
| Miller Sally S | -- | None Available | |
| Lorah David P | $96,000 | -- | |
| Barnhouse Brock D | $79,500 | Titlesource Ltd | |
| Wilson Family Revocable Living | -- | -- | |
| Wilson Lowell O | $55,000 | -- |
Source: Public Records
Mortgage History
| Date | Status | Borrower | Loan Amount |
|---|---|---|---|
| Previous Owner | Lorah David P | $71,000 | |
| Previous Owner | Barnhouse Brock D | $81,700 |
Source: Public Records
Tax History Compared to Growth
Tax History
| Year | Tax Paid | Tax Assessment Tax Assessment Total Assessment is a certain percentage of the fair market value that is determined by local assessors to be the total taxable value of land and additions on the property. | Land | Improvement |
|---|---|---|---|---|
| 2024 | $1,878 | $48,170 | $12,250 | $35,920 |
| 2023 | $1,878 | $137,640 | $35,000 | $102,640 |
| 2022 | $1,894 | $48,174 | $12,250 | $35,924 |
| 2021 | $1,714 | $40,940 | $8,918 | $32,022 |
| 2020 | $1,719 | $40,940 | $8,918 | $32,022 |
| 2019 | $1,728 | $40,940 | $8,918 | $32,022 |
| 2018 | $1,388 | $34,550 | $7,530 | $27,020 |
| 2017 | $1,388 | $34,550 | $7,530 | $27,020 |
| 2016 | $1,391 | $34,550 | $7,530 | $27,020 |
| 2014 | $1,336 | $32,870 | $7,000 | $25,870 |
| 2013 | $1,247 | $32,870 | $7,000 | $25,870 |
Source: Public Records
Map
Nearby Homes
- 201 Parkhill Dr NE
- 0 W Main St Unit 5163516
- 0 W Main St Unit 5163469
- 806 W Main St
- 0 W Main Street Rear
- 191 Heritage Crossing SE
- 0 Miller Ave SW
- 0 Miller Ave SW
- 0 Miller Ave SW
- 0 SW Main St Rear
- 430 Bahler St SW
- 834 Geneva St SW
- 128 Rhine St SW
- 325 Lugano St SW
- 2969 Hope Springs Dr NW
- 264 Pleasant Valley Rd NW
- 4534 Township Road 447
- 5827 Old Route 39 NW
- 3153 Boltz Orchard Rd SW
- 4700 Olde Pump St
- 232 Dover Rd NE
- 310 Dover Rd NE
- 226 Dover Rd NE
- 318 Dover Rd NE
- 235 Dover Rd NE
- 222 Dover Rd NE
- 324 Dover Rd NE
- 307 Dover Rd NE
- 214 Dover Rd NE
- 214 Dover Rd NE
- 315 Dover Rd NE
- 225 Dover Rd NE
- 212 NE Bitikofer Dr NE
- 210 Dover Rd NE
- 319 Dover Rd NE
- 332 Dover Rd NE
- 238 Edgemore St NE
- 323 Dover Rd NE
- 204 Dover Rd NE
- 338 Dover Rd NE