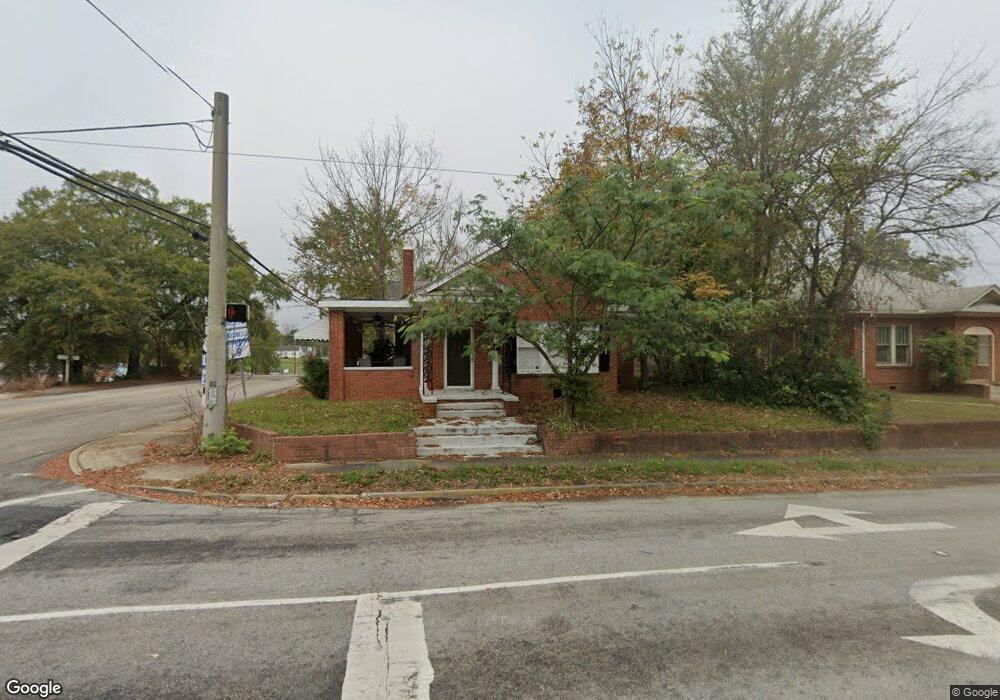
300 E Arch St Lancaster, SC 29720
Estimated Value: $174,000 - $288,000
Studio
1
Bath
2,000
Sq Ft
$114/Sq Ft
Est. Value
About This Home
This home is located at 300 E Arch St, Lancaster, SC 29720 and is currently estimated at $227,037, approximately $113 per square foot. 300 E Arch St is a home located in Lancaster County with nearby schools including Brooklyn Springs Elementary School, Buford Middle School, and Lancaster High School.
Ownership History
Date
Name
Owned For
Owner Type
Purchase Details
Closed on
Aug 14, 2008
Sold by
Fannie Mae
Bought by
Richardson Carl L and Richardson Angie S
Current Estimated Value
Purchase Details
Closed on
May 20, 2008
Sold by
Rivera Clara F
Bought by
Federal National Mortgage Association
Purchase Details
Closed on
Sep 18, 2006
Sold by
Jackson Davarus J
Bought by
Rivera Clara F
Home Financials for this Owner
Home Financials are based on the most recent Mortgage that was taken out on this home.
Original Mortgage
$76,000
Interest Rate
6.48%
Mortgage Type
New Conventional
Create a Home Valuation Report for This Property
The Home Valuation Report is an in-depth analysis detailing your home's value as well as a comparison with similar homes in the area
Home Values in the Area
Average Home Value in this Area
Purchase History
| Date | Buyer | Sale Price | Title Company |
|---|---|---|---|
| Richardson Carl L | -- | -- | |
| Federal National Mortgage Association | $2,500 | -- | |
| Rivera Clara F | $76,000 | None Available |
Source: Public Records
Mortgage History
| Date | Status | Borrower | Loan Amount |
|---|---|---|---|
| Previous Owner | Rivera Clara F | $76,000 |
Source: Public Records
Tax History
| Year | Tax Paid | Tax Assessment Tax Assessment Total Assessment is a certain percentage of the fair market value that is determined by local assessors to be the total taxable value of land and additions on the property. | Land | Improvement |
|---|---|---|---|---|
| 2025 | $2,446 | $6,427 | $439 | $5,988 |
| 2024 | $2,446 | $5,588 | $573 | $5,015 |
| 2023 | $2,492 | $3,726 | $382 | $3,344 |
| 2022 | $888 | $3,726 | $382 | $3,344 |
| 2021 | $876 | $3,726 | $382 | $3,344 |
| 2020 | $821 | $3,496 | $416 | $3,080 |
| 2019 | $1,656 | $3,240 | $386 | $2,854 |
| 2018 | $1,054 | $3,240 | $386 | $2,854 |
| 2017 | $699 | $0 | $0 | $0 |
| 2016 | $721 | $0 | $0 | $0 |
| 2015 | $619 | $0 | $0 | $0 |
| 2014 | $619 | $0 | $0 | $0 |
| 2013 | $619 | $0 | $0 | $0 |
Source: Public Records
Map
Nearby Homes
Your Personal Tour Guide
Ask me questions while you tour the home.