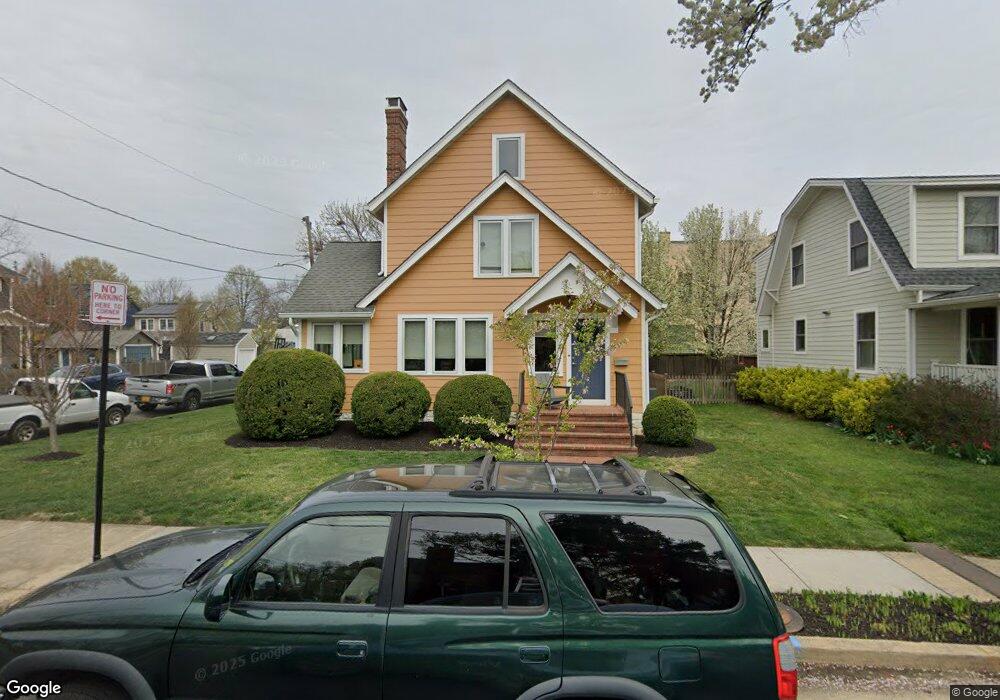
300 E Luray Ave Alexandria, VA 22301
Del Ray NeighborhoodEstimated Value: $1,472,418 - $1,908,000
Studio
4
Baths
2,718
Sq Ft
$612/Sq Ft
Est. Value
About This Home
This home is located at 300 E Luray Ave, Alexandria, VA 22301 and is currently estimated at $1,663,355, approximately $611 per square foot. 300 E Luray Ave is a home located in Alexandria City with nearby schools including Jefferson-Houston Elementary School, Alexandria City High School, and The Del Ray Montessori School.
Ownership History
Date
Name
Owned For
Owner Type
Purchase Details
Closed on
Jul 2, 2024
Sold by
Vanzoeren Rebecca Marie
Bought by
Rebecca M Van Zoeren Revocable Trust and Zoeren Van
Current Estimated Value
Purchase Details
Closed on
Jun 23, 2021
Sold by
Carl Vanzoeren Thomas and Carl Marie Rebecca
Bought by
Vanzoeren Rebecca Marie
Create a Home Valuation Report for This Property
The Home Valuation Report is an in-depth analysis detailing your home's value as well as a comparison with similar homes in the area
Home Values in the Area
Average Home Value in this Area
Purchase History
| Date | Buyer | Sale Price | Title Company |
|---|---|---|---|
| Rebecca M Van Zoeren Revocable Trust | -- | None Listed On Document | |
| Vanzoeren Rebecca Marie | -- | Hirsch & Ehlenberger Pc | |
| Vanzoeren Rebecca Marie | -- | None Listed On Document | |
| Vanzoeren Rebecca Marie | -- | None Listed On Document |
Source: Public Records
Tax History
| Year | Tax Paid | Tax Assessment Tax Assessment Total Assessment is a certain percentage of the fair market value that is determined by local assessors to be the total taxable value of land and additions on the property. | Land | Improvement |
|---|---|---|---|---|
| 2025 | $14,850 | $1,236,419 | $592,919 | $643,500 |
| 2024 | $14,850 | $1,236,419 | $592,919 | $643,500 |
| 2023 | $13,724 | $1,236,419 | $592,919 | $643,500 |
| 2022 | $13,255 | $1,194,175 | $570,114 | $624,061 |
| 2021 | $12,577 | $1,133,091 | $509,030 | $624,061 |
| 2020 | $12,346 | $1,064,433 | $467,000 | $597,433 |
| 2019 | $11,562 | $1,023,156 | $453,200 | $569,956 |
| 2018 | $11,413 | $1,009,956 | $440,000 | $569,956 |
| 2017 | $11,353 | $1,004,663 | $440,000 | $564,663 |
| 2016 | $10,780 | $1,004,663 | $440,000 | $564,663 |
| 2015 | $9,778 | $937,492 | $415,000 | $522,492 |
| 2014 | $9,506 | $911,438 | $365,806 | $545,632 |
Source: Public Records
Map
Nearby Homes
- 127 E Glendale Ave
- 304 E Nelson Ave
- 3 E Alexandria Ave
- 3 W Glendale Ave
- 546 E Nelson Ave
- 1700 Dewitt Ave
- 565 E Nelson Ave
- 15 W Spring St
- 1800 Mount Vernon Ave Unit 207
- 1800 Mount Vernon Ave Unit 306
- 106 E Maple St
- 1417 van Valkenburgh Ln
- 100 E Maple St
- 402 Commonwealth Ave Unit 106
- 402 Commonwealth Ave Unit 206
- 1217 Madison St
- 400 Commonwealth Ave Unit 307
- 14 W Bellefonte Ave
- 560 N West St
- 564 N West St
- 302 E Luray Ave
- 304 E Luray Ave
- 216 E Luray Ave
- 301 E Luray Ave
- 303 E Luray Ave
- 214 E Luray Ave
- 217 E Alexandria Ave
- 301 E Alexandria Ave
- 305 E Luray Ave
- 217 E Luray Ave
- 1302 Mount Vernon Ave
- 215 E Alexandria Ave
- 212 E Luray Ave
- 307 E Luray Ave
- 215 E Luray Ave
- 1310 Mount Vernon Ave
- 213 E Alexandria Ave
- 300 E Glendale Ave
- 213 E Luray Ave
- 210 E Luray Ave
Your Personal Tour Guide
Ask me questions while you tour the home.