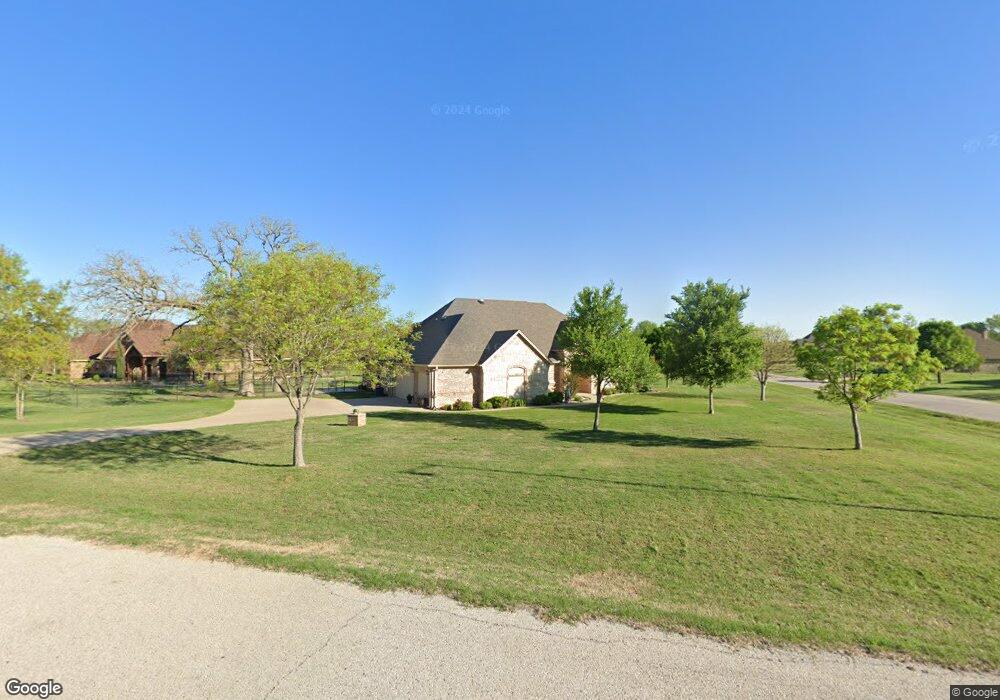
300 Ellis Creek Ct Weatherford, TX 76085
Estimated Value: $524,397 - $595,000
3
Beds
2
Baths
2,348
Sq Ft
$239/Sq Ft
Est. Value
About This Home
This home is located at 300 Ellis Creek Ct, Weatherford, TX 76085 and is currently estimated at $561,099, approximately $238 per square foot. 300 Ellis Creek Ct is a home located in Parker County with nearby schools including Crockett Elementary School, Tison Middle School, and Weatherford High School.
Ownership History
Date
Name
Owned For
Owner Type
Purchase Details
Closed on
Apr 14, 2020
Sold by
Kiss Sarah E and Kiss Zoltan J
Bought by
Kiss Zoltan Joe and Kiss Sarah Elizabeth
Current Estimated Value
Purchase Details
Closed on
Jun 14, 2012
Sold by
Drew Ulman James
Bought by
Kiss Sarah E and Kiss Zoltan J
Home Financials for this Owner
Home Financials are based on the most recent Mortgage that was taken out on this home.
Original Mortgage
$184,700
Interest Rate
3.86%
Mortgage Type
New Conventional
Purchase Details
Closed on
Jul 29, 2011
Sold by
Frysinger Construction Llc
Bought by
Kiss Sarah E and Kiss Zoltan J
Purchase Details
Closed on
May 13, 2010
Sold by
First National Bank Of W Ford
Bought by
Kiss Sarah E and Kiss Zoltan J
Purchase Details
Closed on
Jan 7, 2010
Sold by
Ellis Parker Creek Lp
Bought by
Kiss Sarah E and Kiss Zoltan J
Purchase Details
Closed on
Dec 28, 2007
Sold by
Ellis Parker Creek Lp
Bought by
Kiss Sarah E and Kiss Zoltan J
Create a Home Valuation Report for This Property
The Home Valuation Report is an in-depth analysis detailing your home's value as well as a comparison with similar homes in the area
Home Values in the Area
Average Home Value in this Area
Purchase History
| Date | Buyer | Sale Price | Title Company |
|---|---|---|---|
| Kiss Zoltan Joe | -- | None Available | |
| Kiss Sarah E | -- | Stewart | |
| Kiss Sarah E | -- | -- | |
| Kiss Sarah E | -- | -- | |
| Kiss Sarah E | -- | -- | |
| Kiss Sarah E | -- | -- |
Source: Public Records
Mortgage History
| Date | Status | Borrower | Loan Amount |
|---|---|---|---|
| Previous Owner | Kiss Sarah E | $184,700 |
Source: Public Records
Tax History Compared to Growth
Tax History
| Year | Tax Paid | Tax Assessment Tax Assessment Total Assessment is a certain percentage of the fair market value that is determined by local assessors to be the total taxable value of land and additions on the property. | Land | Improvement |
|---|---|---|---|---|
| 2025 | $2,746 | $467,447 | -- | -- |
| 2024 | $2,746 | $424,952 | -- | -- |
| 2023 | $2,746 | $386,320 | $0 | $0 |
| 2022 | $6,539 | $351,200 | $40,000 | $311,200 |
| 2021 | $7,089 | $351,200 | $40,000 | $311,200 |
| 2020 | $6,802 | $335,340 | $40,000 | $295,340 |
| 2019 | $6,945 | $335,340 | $40,000 | $295,340 |
| 2018 | $6,347 | $291,790 | $40,000 | $251,790 |
| 2017 | $6,327 | $291,790 | $40,000 | $251,790 |
| 2016 | $5,752 | $259,150 | $40,000 | $219,150 |
| 2015 | $4,370 | $259,150 | $40,000 | $219,150 |
| 2014 | $4,233 | $230,680 | $40,000 | $190,680 |
Source: Public Records
Map
Nearby Homes
- 150 Ellis Spring Dr
- 209 Ellis Creek Dr
- 161 Cochran Rd
- 600 Joyce St
- 2358 Tanglewood St
- 2277 Tanglewood St
- 109 Odel Dr
- 1835 N Main St
- 1829 N Main St
- 1712 Madison St
- 305-B E 8th St
- 305 E 8th St
- 125 Odel Dr
- 1813 Roadrunner Dr
- 221 E 7th St
- 201 E 7th St
- 203 E 7th St
- 1713 N Main St
- 1727 N Main St
- 506 E 5th St
- 140 Finney Rd
- 670 Finney Rd
- 180 Finney Rd
- 700 Finney Rd
- 190 Finney Rd
- 306 Ellis Creek Ct
- 112 Ellis Spring Dr
- 119 Ellis Spring Dr
- 125 Ellis Spring Dr
- 301 Ellis Creek Ct
- 312 Ellis Creek Ct
- 113 Ellis Spring Dr
- 106 Ellis Spring Dr
- 131 Ellis Spring Dr
- 313 Ellis Creek Ct
- 107 Ellis Spring Dr
- 137 Ellis Spring Dr
- 138 Ellis Spring Dr
- 520 N Bend Rd
- 115 Ellis Creek Dr