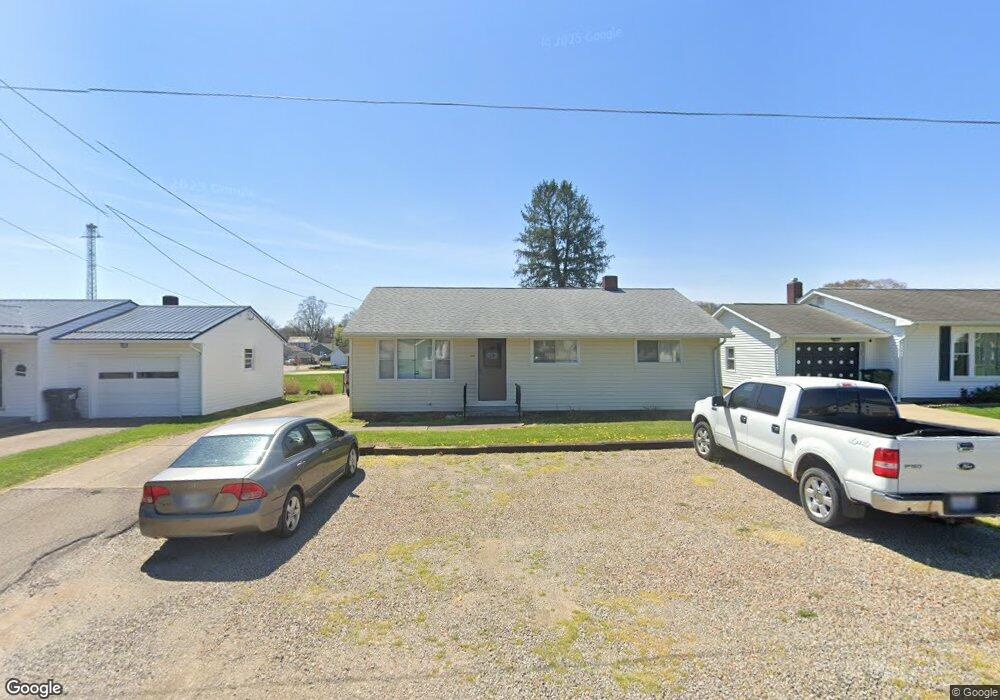
300 Elm St Duncan Falls, OH 43734
Estimated Value: $221,000 - $257,000
3
Beds
1
Bath
1,107
Sq Ft
$216/Sq Ft
Est. Value
About This Home
This home is located at 300 Elm St, Duncan Falls, OH 43734 and is currently estimated at $238,726, approximately $215 per square foot. 300 Elm St is a home with nearby schools including Philo High School.
Ownership History
Date
Name
Owned For
Owner Type
Purchase Details
Closed on
Apr 26, 2021
Sold by
Disbennett Kenneth R and Disbennett Brittany D
Bought by
Searls Jordon R
Current Estimated Value
Home Financials for this Owner
Home Financials are based on the most recent Mortgage that was taken out on this home.
Original Mortgage
$130,500
Outstanding Balance
$118,081
Interest Rate
3%
Mortgage Type
New Conventional
Estimated Equity
$120,645
Purchase Details
Closed on
May 31, 2019
Sold by
Riley Timothy L and Riley Stacee
Bought by
Disbennett Kenneth R and Disbennett Brittany D
Home Financials for this Owner
Home Financials are based on the most recent Mortgage that was taken out on this home.
Original Mortgage
$101,010
Interest Rate
4.1%
Mortgage Type
New Conventional
Purchase Details
Closed on
May 24, 2016
Bought by
L Riley Timothy
Home Financials for this Owner
Home Financials are based on the most recent Mortgage that was taken out on this home.
Interest Rate
3.58%
Purchase Details
Closed on
Jul 23, 2013
Sold by
Woodruff Walter
Bought by
Williams Roy and Williams Mary Lou
Create a Home Valuation Report for This Property
The Home Valuation Report is an in-depth analysis detailing your home's value as well as a comparison with similar homes in the area
Home Values in the Area
Average Home Value in this Area
Purchase History
| Date | Buyer | Sale Price | Title Company |
|---|---|---|---|
| Searls Jordon R | $145,000 | First American Title Ins | |
| Disbennett Kenneth R | $95,000 | None Available | |
| L Riley Timothy | $83,000 | -- | |
| Williams Roy | $75,000 | None Available |
Source: Public Records
Mortgage History
| Date | Status | Borrower | Loan Amount |
|---|---|---|---|
| Open | Searls Jordon R | $130,500 | |
| Previous Owner | Disbennett Kenneth R | $101,010 | |
| Previous Owner | L Riley Timothy | -- |
Source: Public Records
Tax History Compared to Growth
Tax History
| Year | Tax Paid | Tax Assessment Tax Assessment Total Assessment is a certain percentage of the fair market value that is determined by local assessors to be the total taxable value of land and additions on the property. | Land | Improvement |
|---|---|---|---|---|
| 2024 | $1,620 | $49,000 | $4,410 | $44,590 |
| 2023 | $1,250 | $35,875 | $3,395 | $32,480 |
| 2022 | $1,200 | $35,875 | $3,395 | $32,480 |
| 2021 | $1,150 | $35,875 | $3,395 | $32,480 |
| 2020 | $1,068 | $32,620 | $3,080 | $29,540 |
| 2019 | $1,066 | $32,620 | $3,080 | $29,540 |
| 2018 | $1,074 | $32,620 | $3,080 | $29,540 |
| 2017 | $1,042 | $29,190 | $3,080 | $26,110 |
| 2016 | $1,030 | $29,190 | $3,080 | $26,110 |
| 2015 | $1,058 | $29,190 | $3,080 | $26,110 |
| 2013 | $1,053 | $27,720 | $3,080 | $24,640 |
Source: Public Records
Map
Nearby Homes
- 310 Elm St
- 243 Mill St
- 250 Sycamore St
- 385 Water St
- 512 North St
- 135 Front St
- 142 Main St
- 252 Front St
- 426 Main St
- 431 Front St
- 4495 Old River Rd
- 4145 Old River Rd
- 0 Sealover Hollow Rd
- 1790 Candlestick Dr
- 7979 Old River Rd
- 2519 Frick Dr
- 2630 Glenn Cir
- 3010 S River Rd
- 2400 Irish Ridge Rd
- 8285 Old River Rd