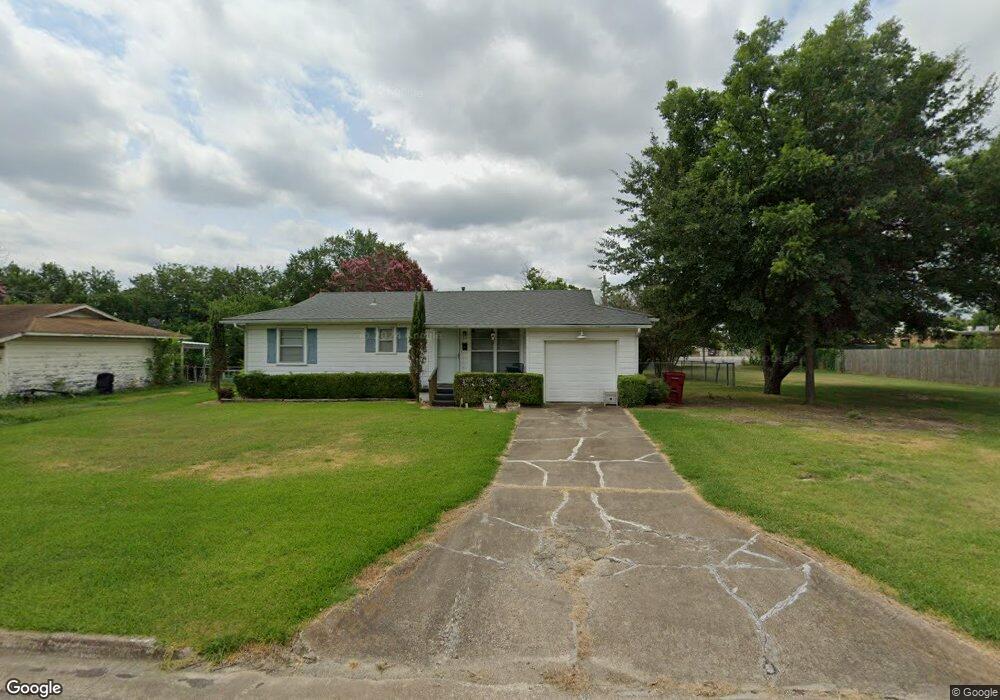
300 Fannin Ave Bonham, TX 75418
Estimated Value: $134,520 - $173,000
--
Bed
--
Bath
864
Sq Ft
$174/Sq Ft
Est. Value
About This Home
This home is located at 300 Fannin Ave, Bonham, TX 75418 and is currently estimated at $150,630, approximately $174 per square foot. 300 Fannin Ave is a home located in Fannin County with nearby schools including Finley-Oates Elementary School, LH Rather Jr High School, and Morning Star Academy.
Ownership History
Date
Name
Owned For
Owner Type
Purchase Details
Closed on
Sep 15, 2021
Sold by
Clark Betty R
Bought by
Herrington David and Herrimgton Janie
Current Estimated Value
Purchase Details
Closed on
Jan 25, 2009
Sold by
Johansson Amanda K Carter
Bought by
Clark Betty R
Create a Home Valuation Report for This Property
The Home Valuation Report is an in-depth analysis detailing your home's value as well as a comparison with similar homes in the area
Home Values in the Area
Average Home Value in this Area
Purchase History
| Date | Buyer | Sale Price | Title Company |
|---|---|---|---|
| Herrington David | -- | None Available | |
| Clark Betty R | -- | None Available |
Source: Public Records
Tax History Compared to Growth
Tax History
| Year | Tax Paid | Tax Assessment Tax Assessment Total Assessment is a certain percentage of the fair market value that is determined by local assessors to be the total taxable value of land and additions on the property. | Land | Improvement |
|---|---|---|---|---|
| 2025 | $2,239 | $116,570 | $47,460 | $69,110 |
| 2024 | $2,239 | $115,440 | $44,700 | $70,740 |
| 2023 | $2,280 | $115,610 | $44,700 | $70,910 |
| 2022 | $2,260 | $102,740 | $32,270 | $70,470 |
| 2021 | $1,841 | $72,840 | $15,190 | $57,650 |
| 2020 | $1,751 | $68,520 | $14,060 | $54,460 |
| 2019 | $1,664 | $66,800 | $11,550 | $55,250 |
| 2018 | $1,510 | $56,910 | $11,550 | $45,360 |
| 2017 | $1,353 | $52,940 | $11,550 | $41,390 |
| 2016 | $1,330 | $52,020 | $11,550 | $40,470 |
| 2015 | -- | $48,850 | $11,300 | $37,550 |
| 2014 | -- | $48,940 | $11,300 | $37,640 |
Source: Public Records
Map
Nearby Homes
- 2023 N Center St
- 000 S State Highway 78
- 200 Victory St
- 0000 Texas 78
- 5354 S State Highway 78
- 1913 N Main St
- 253 Graham Ave
- 2109 Island Bayou
- 108 Leslie St
- 400 Martin St
- 1711 Oriental St
- 204 W Boyd St
- 0000 S State Highway 78
- 2108 Agnew St
- 1905 Agnew St
- 1604 N Center St
- 812 Mockingbird St
- 606 Hunter St
- 1509 Island Bayou Rd
- 1525 Franklin St
- 302 Fannin Ave
- 304 Fannin Ave
- 289 Glen Oaks Rd
- 301 Fannin Ave
- 303 Fannin Ave
- 306 Fannin Ave
- 2022 N Center St
- 291 Glen Oaks Rd
- 305 Fannin Ave
- 307 Fannin Ave
- 308 Fannin Ave
- 293 Glen Oaks Rd
- 290 Glen Oaks Rd
- 300 E Russell Ave
- 302 E Russell Ave
- 309 Fannin Ave
- 310 Fannin Ave
- 273 N Center St
- 204 E Russell Ave
- 0000 N Center St