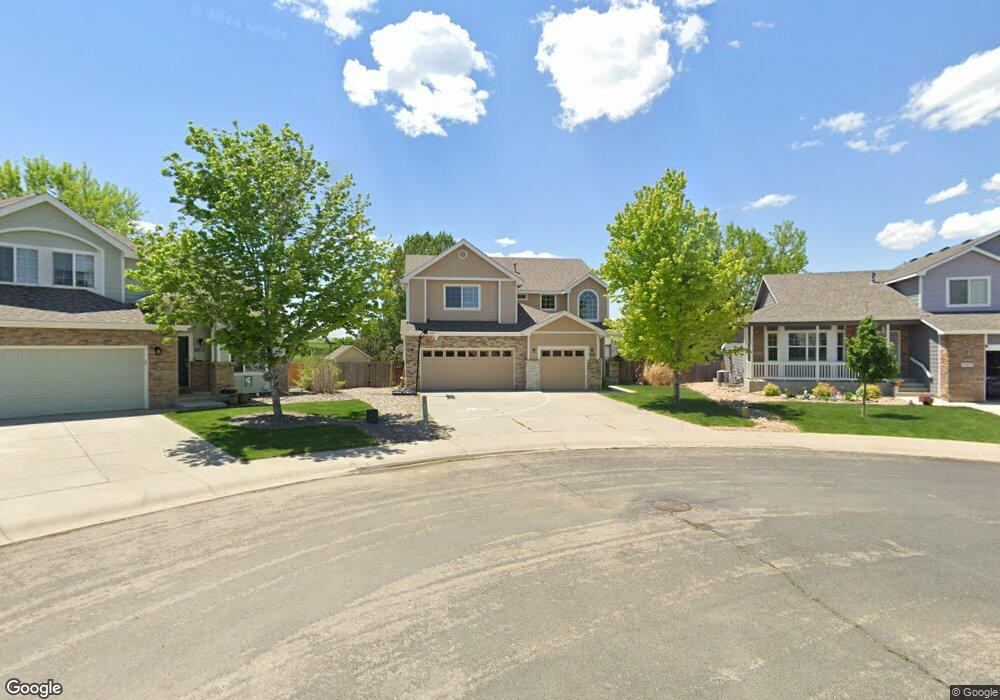
300 Fossil Dr Johnstown, CO 80534
Estimated Value: $550,918 - $607,000
4
Beds
3
Baths
2,591
Sq Ft
$225/Sq Ft
Est. Value
About This Home
This home is located at 300 Fossil Dr, Johnstown, CO 80534 and is currently estimated at $582,230, approximately $224 per square foot. 300 Fossil Dr is a home located in Weld County with nearby schools including Pioneer Ridge Elementary School, Milliken Middle School, and Roosevelt High School.
Ownership History
Date
Name
Owned For
Owner Type
Purchase Details
Closed on
Apr 18, 2019
Sold by
Nein Marc A
Bought by
Nein Marc A and Nein Jamie L
Current Estimated Value
Home Financials for this Owner
Home Financials are based on the most recent Mortgage that was taken out on this home.
Original Mortgage
$332,000
Outstanding Balance
$215,520
Interest Rate
4.3%
Mortgage Type
New Conventional
Estimated Equity
$366,710
Purchase Details
Closed on
May 29, 2009
Sold by
Vanhattem James
Bought by
Nein Marc A
Home Financials for this Owner
Home Financials are based on the most recent Mortgage that was taken out on this home.
Original Mortgage
$248,417
Interest Rate
4.72%
Mortgage Type
FHA
Purchase Details
Closed on
May 10, 2007
Sold by
Woodcrest Homes Inc
Bought by
Vanhattem James
Home Financials for this Owner
Home Financials are based on the most recent Mortgage that was taken out on this home.
Original Mortgage
$241,273
Interest Rate
8.5%
Mortgage Type
New Conventional
Create a Home Valuation Report for This Property
The Home Valuation Report is an in-depth analysis detailing your home's value as well as a comparison with similar homes in the area
Home Values in the Area
Average Home Value in this Area
Purchase History
| Date | Buyer | Sale Price | Title Company |
|---|---|---|---|
| Nein Marc A | -- | Heritage Title Co | |
| Nein Marc A | $253,000 | Land Title Guarantee Company | |
| Vanhattem James | $253,972 | Land Title |
Source: Public Records
Mortgage History
| Date | Status | Borrower | Loan Amount |
|---|---|---|---|
| Open | Nein Marc A | $332,000 | |
| Closed | Nein Marc A | $248,417 | |
| Previous Owner | Vanhattem James | $241,273 |
Source: Public Records
Tax History Compared to Growth
Tax History
| Year | Tax Paid | Tax Assessment Tax Assessment Total Assessment is a certain percentage of the fair market value that is determined by local assessors to be the total taxable value of land and additions on the property. | Land | Improvement |
|---|---|---|---|---|
| 2025 | $3,256 | $35,760 | $7,060 | $28,700 |
| 2024 | $3,256 | $35,760 | $7,060 | $28,700 |
| 2023 | $3,058 | $37,090 | $5,750 | $31,340 |
| 2022 | $3,078 | $28,700 | $5,070 | $23,630 |
| 2021 | $3,318 | $29,530 | $5,220 | $24,310 |
| 2020 | $3,057 | $27,990 | $4,650 | $23,340 |
| 2019 | $2,391 | $27,990 | $4,650 | $23,340 |
| 2018 | $2,162 | $25,290 | $3,960 | $21,330 |
| 2017 | $2,198 | $25,290 | $3,960 | $21,330 |
| 2016 | $1,916 | $22,040 | $3,580 | $18,460 |
| 2015 | $1,942 | $22,040 | $3,580 | $18,460 |
| 2014 | $1,558 | $18,250 | $3,580 | $14,670 |
Source: Public Records
Map
Nearby Homes
- 243 Wyss St
- 409 Granite Way
- 3760 Barnard Ln
- 3774 Brunner Blvd
- 4308 Limestone Ln
- 224 Alabaster Way
- 3688 Wittaker Cir
- 294 Holden Ln
- 277 Holden Ln
- 216 Tartan Dr
- 278 Kobe Ln
- 294 Kobe Ln
- 286 Kobe Ln
- 272 Mia Ln
- 287 Kobe Ln
- 4511 Mountain Sky St
- 4507 Moose St
- 4591 Sugar Beet St
- 4615 Sugar Beet St
- Hartford Plan at Ledge Rock - The Camden Collection
- 4012 Fossil Dr
- 306 Fossil Dr
- 4006 Fossil Dr
- 301 Moss Rock Way
- 312 Fossil Dr
- 307 Moss Rock Way
- 4000 Fossil Dr
- 309 Fossil Dr
- 313 Moss Rock Way
- 318 Fossil Dr
- 4036 Flagstone Dr
- 315 Fossil Dr
- 319 Moss Rock Way
- 324 Fossil Dr
- 3946 Gemstone Ln
- 4042 Flagstone Dr
- 310 Gemstone Ln
- 321 Fossil Dr
- 325 Moss Rock Way
- 316 Gemstone Ln