Estimated Value: $158,000 - $178,834
3
Beds
2
Baths
1,927
Sq Ft
$86/Sq Ft
Est. Value
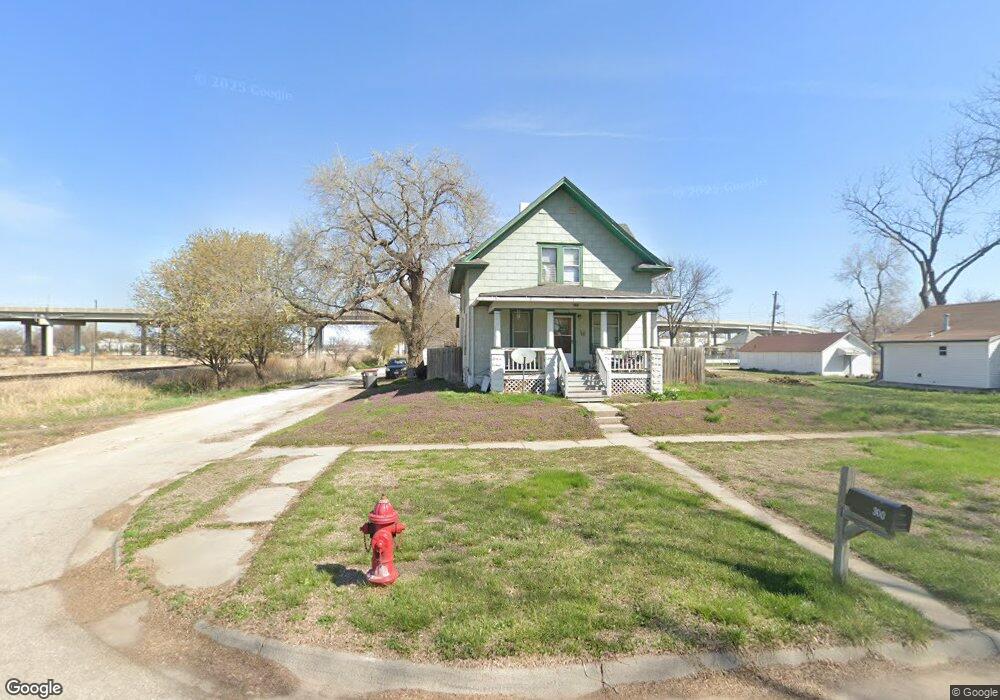
About This Home
This home is located at 300 G St, Lincoln, NE 68508 and is currently estimated at $164,959, approximately $85 per square foot. 300 G St is a home located in Lancaster County with nearby schools including Everett Elementary School, Park Middle School, and Lincoln High School.
Ownership History
Date
Name
Owned For
Owner Type
Purchase Details
Closed on
Sep 21, 2009
Sold by
King Randal Dean
Bought by
Longwell Jamie
Current Estimated Value
Home Financials for this Owner
Home Financials are based on the most recent Mortgage that was taken out on this home.
Original Mortgage
$78,226
Outstanding Balance
$51,599
Interest Rate
5.36%
Mortgage Type
New Conventional
Estimated Equity
$113,360
Purchase Details
Closed on
Apr 28, 1998
Sold by
King Anita Gail
Bought by
King Randal Dean
Create a Home Valuation Report for This Property
The Home Valuation Report is an in-depth analysis detailing your home's value as well as a comparison with similar homes in the area
Home Values in the Area
Average Home Value in this Area
Purchase History
| Date | Buyer | Sale Price | Title Company |
|---|---|---|---|
| Longwell Jamie | $77,000 | Ntc | |
| King Randal Dean | -- | -- |
Source: Public Records
Mortgage History
| Date | Status | Borrower | Loan Amount |
|---|---|---|---|
| Open | Longwell Jamie | $78,226 |
Source: Public Records
Tax History Compared to Growth
Tax History
| Year | Tax Paid | Tax Assessment Tax Assessment Total Assessment is a certain percentage of the fair market value that is determined by local assessors to be the total taxable value of land and additions on the property. | Land | Improvement |
|---|---|---|---|---|
| 2025 | $1,972 | $164,000 | $30,600 | $133,400 |
| 2024 | $1,972 | $142,700 | $25,500 | $117,200 |
| 2023 | $2,392 | $142,700 | $25,500 | $117,200 |
| 2022 | $2,127 | $106,700 | $23,000 | $83,700 |
| 2021 | $2,012 | $106,700 | $23,000 | $83,700 |
| 2020 | $1,611 | $84,300 | $21,300 | $63,000 |
| 2019 | $1,611 | $84,300 | $21,300 | $63,000 |
| 2018 | $1,645 | $85,700 | $21,300 | $64,400 |
| 2017 | $1,660 | $85,700 | $21,300 | $64,400 |
| 2016 | $1,519 | $78,000 | $21,300 | $56,700 |
| 2015 | $1,508 | $78,000 | $21,300 | $56,700 |
| 2014 | $1,437 | $73,900 | $17,000 | $56,900 |
| 2013 | -- | $74,000 | $21,300 | $52,700 |
Source: Public Records
Map
Nearby Homes