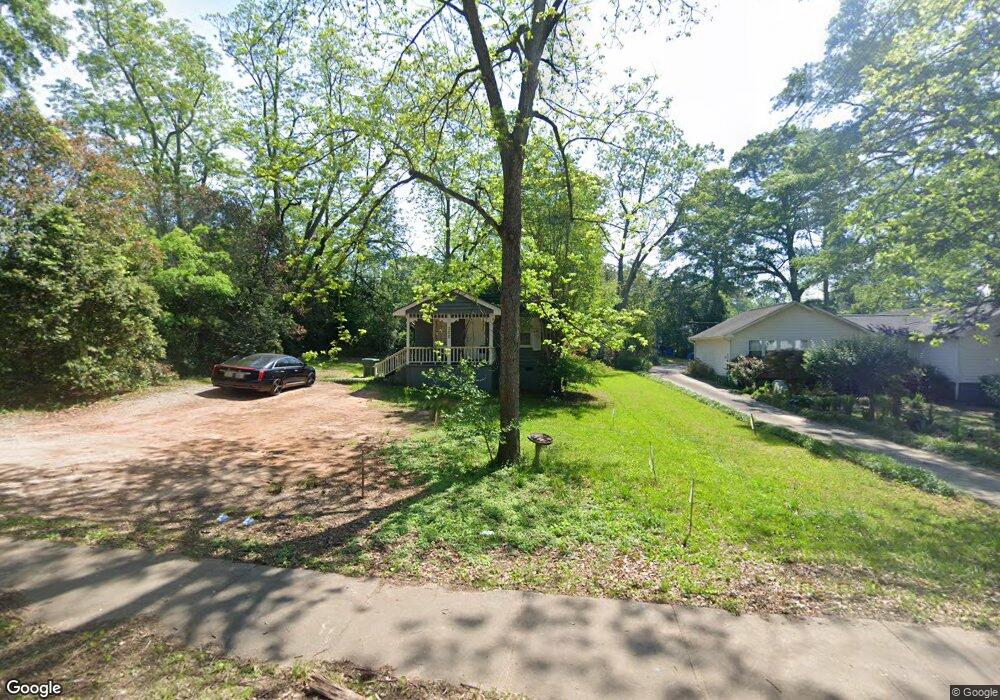
300 Hammond+22 Griffin, GA 30224
Spalding County NeighborhoodEstimated Value: $107,000 - $134,000
--
Bed
--
Bath
960
Sq Ft
$127/Sq Ft
Est. Value
About This Home
This home is located at 300 Hammond+22, Griffin, GA 30224 and is currently estimated at $121,615, approximately $126 per square foot. 300 Hammond+22 is a home located in Spalding County with nearby schools including Anne Street Elementary School, Rehoboth Road Middle School, and Griffin High School.
Ownership History
Date
Name
Owned For
Owner Type
Purchase Details
Closed on
Dec 30, 2019
Sold by
Dash Capital Llc
Bought by
Missions Investments Llc
Current Estimated Value
Purchase Details
Closed on
Sep 6, 2017
Sold by
Hunt Mary Frances Rider E
Bought by
Dash Capital Llc
Purchase Details
Closed on
Oct 30, 2000
Sold by
City Of Griffin
Bought by
Hunt Mary R
Purchase Details
Closed on
Apr 30, 1998
Sold by
Woodham Wilson J
Bought by
Breland Brant
Home Financials for this Owner
Home Financials are based on the most recent Mortgage that was taken out on this home.
Original Mortgage
$56,249
Interest Rate
6.87%
Mortgage Type
New Conventional
Purchase Details
Closed on
Sep 26, 1991
Bought by
Henson Ruby Woodham
Purchase Details
Closed on
Jul 17, 1986
Sold by
Woodham Wilson J and Woodham Marlene
Bought by
Henson Ruby Woodham
Create a Home Valuation Report for This Property
The Home Valuation Report is an in-depth analysis detailing your home's value as well as a comparison with similar homes in the area
Home Values in the Area
Average Home Value in this Area
Purchase History
| Date | Buyer | Sale Price | Title Company |
|---|---|---|---|
| Missions Investments Llc | $670 | -- | |
| Dash Capital Llc | $47,500 | -- | |
| Hunt Mary Frances Rider Estate | -- | -- | |
| Hunt Mary R | $65,000 | -- | |
| City Of Griffin | $65,000 | -- | |
| Breland Brant | $59,300 | -- | |
| Henson Ruby Woodham | -- | -- | |
| Henson Ruby Woodham | -- | -- |
Source: Public Records
Mortgage History
| Date | Status | Borrower | Loan Amount |
|---|---|---|---|
| Previous Owner | Breland Brant | $56,249 |
Source: Public Records
Tax History Compared to Growth
Tax History
| Year | Tax Paid | Tax Assessment Tax Assessment Total Assessment is a certain percentage of the fair market value that is determined by local assessors to be the total taxable value of land and additions on the property. | Land | Improvement |
|---|---|---|---|---|
| 2024 | $1,106 | $28,961 | $4,500 | $24,461 |
| 2023 | $1,106 | $27,869 | $4,500 | $23,369 |
| 2022 | $952 | $23,812 | $3,960 | $19,852 |
| 2021 | $788 | $19,722 | $3,960 | $15,762 |
| 2020 | $725 | $18,147 | $3,960 | $14,187 |
| 2019 | $739 | $18,147 | $3,960 | $14,187 |
| 2018 | $706 | $16,717 | $3,960 | $12,757 |
| 2017 | $457 | $11,055 | $3,960 | $7,095 |
| 2016 | $464 | $11,055 | $3,960 | $7,095 |
| 2015 | $472 | $11,055 | $3,960 | $7,095 |
| 2014 | $486 | $11,055 | $3,960 | $7,095 |
Source: Public Records
Map
Nearby Homes
- 1264 Cherokee Ave
- 1313 D F Fuller Dr
- 309 Cherokee Cir
- 1228-1328 Edgewood Ave
- 141 North Expy
- 305 S 18th St
- 203 Hillside Cir
- 1054 W College Street Extension
- 1326 Oakdale Dr
- 1012 W College Extension
- 1223 W Broad St
- 1206 Hillwood Ave
- 1126 Wright St
- 915 W Poplar St
- 1106 Wright St
- 1022 Beck St
- 1025 W Broad St
- 1017 W Broad St
- 124 Ohoopee Dr
- 930 W Broad St
- 300 Hammond Dr
- 304 Hammond Dr
- 1380 W Poplar St
- 1368 W Poplar St
- 308 Hammond Dr
- 1404 W Poplar St
- 1333 N Cherokee Ave
- 312 Hammond Dr
- 305 Hammond Dr
- 1354 W Poplar St
- 1412 W Poplar St
- 1337 N Cherokee Ave
- 307 Hammond Dr
- 1329 N Cherokee Ave
- 314 Hammond Dr
- 315 Cherokee Ave Unit 13
- 315 Cherokee Ave
- 309 Hammond Dr
- 1414 W Poplar St
- 1342 W Poplar St